

Tendermint Core QA 结果 v0.37.x
发现的问题
在本轮 QA 过程中,发现了以下问题:- (严重,已修复)[ #9533] - 该缺陷会导致全节点在进行区块同步时有时卡住,需要手动重启才能恢复。需要特别指出的是,该缺陷在 v0.34.x 中也存在,且修复也已通过 #9534 回移。
- (严重,已修复)#9539 -
loadtime很可能会在交易中包含多个=字符,而这会被 e2e 应用拒绝。 - (严重,已修复)#9581 - 缺少 Prometheus 标签会导致 CometBFT 在启用 Prometheus 指标采集时崩溃。
- (非严重,未修复)#9548 - 全节点的连接对等节点数可能超过 50,这不符合默认配置的预期。
- (非严重,未修复)#9537 - 在默认 mempool 缓存配置下,经由 gossip 传播的重复交易不会被拒绝,并最终淹没所有 mempool。因此,200 节点测试网运行时将该值设置为 200000(而不是默认的 10000)。
200 节点测试网
查找饱和点
第一个目标是识别饱和点,并将其与基线版本(v0.34.x)进行比较。 更多细节请参见基线版本中的这一段。 下表汇总了 v0.37.x 在不同实验中的结果 (提取自文件v037_report_tabbed.txt)。
该表的 X 轴是 c,表示负载生成进程到目标节点建立的连接数。
该表的 Y 轴是 r,表示每秒发出的交易速率或交易数量。
| c=1 | c=2 | c=4 | |
|---|---|---|---|
| r=25 | 2225 | 4450 | 8900 |
| r=50 | 4450 | 8900 | 17800 |
| r=100 | 8900 | 17800 | 35600 |
| r=200 | 17800 | 35600 | 38660 |
| c=1 | c=2 | c=4 | |
|---|---|---|---|
| r=25 | 2225 | 4450 | 8900 |
| r=50 | 4450 | 8900 | 17800 |
| r=100 | 8900 | 17800 | 35400 |
| r=200 | 17800 | 35600 | 37358 |
r=200,c=2r=100,c=4
r=200,c=2。
在运行 r=200,c=2 时,负载生成器的 CPU 负载可以忽略不计(接近 0)。
延迟分析
采用这里描述的方法,我们可以绘制所有实验中的交易延迟。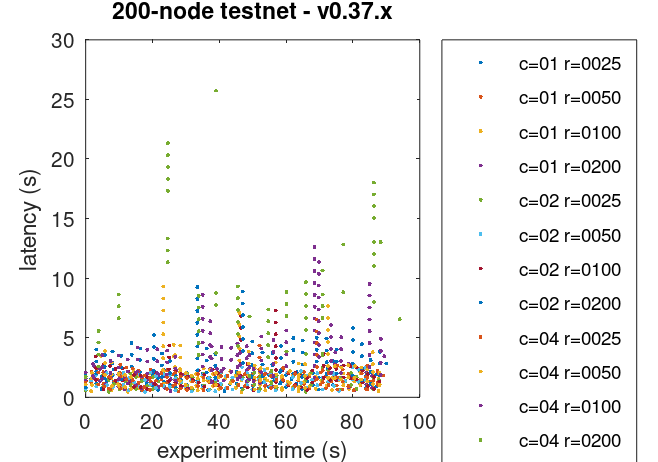 图中数据与基线相似。
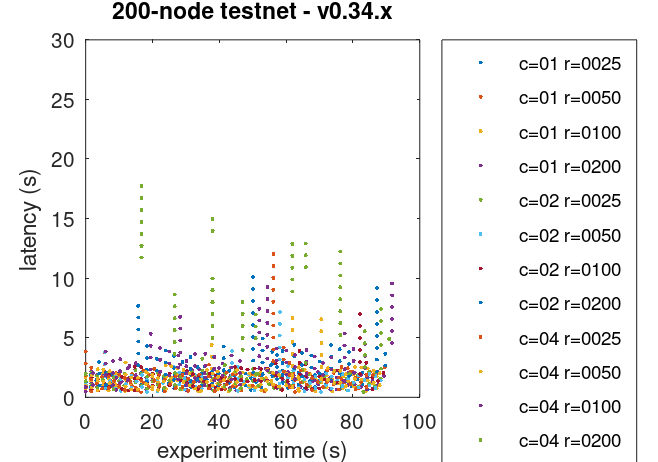 因此,关于这些图的更多细节,请参见基线版本中的这一段。
下图汇总了平均延迟与总体吞吐量之间的关系,
涵盖了向注入交易的节点建立不同数量 WebSocket 连接的情况。
因此,关于这些图的更多细节,请参见基线版本中的这一段。
下图汇总了平均延迟与总体吞吐量之间的关系,
涵盖了向注入交易的节点建立不同数量 WebSocket 连接的情况。
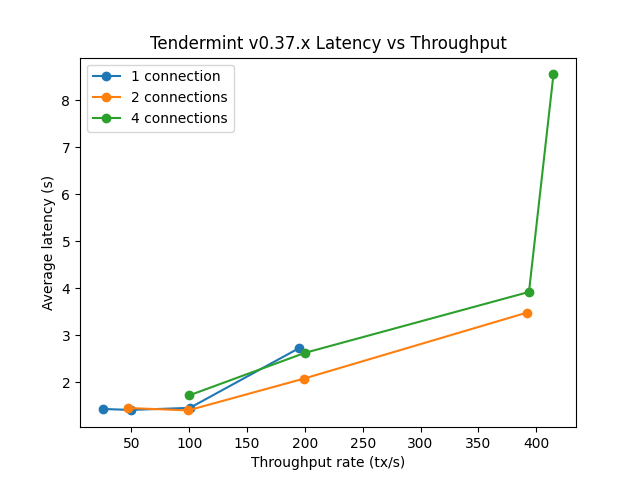 这与基线图相似:
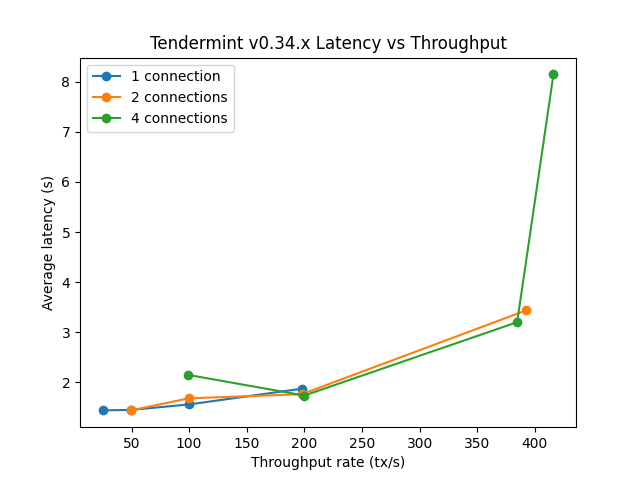
所选实验的 Prometheus 指标
如上文所述,所选实验为r=200,c=2。
本节将进一步分析从 Prometheus 数据中提取出的该实验关键指标。
Mempool 大小
Mempool 大小表示 mempool 中交易数量,在所有全节点上都表现为稳定且分布均匀。 没有出现任何无约束增长。 下图展示了在给定时刻,所有全节点 mempool 内交易累计数量随时间的变化。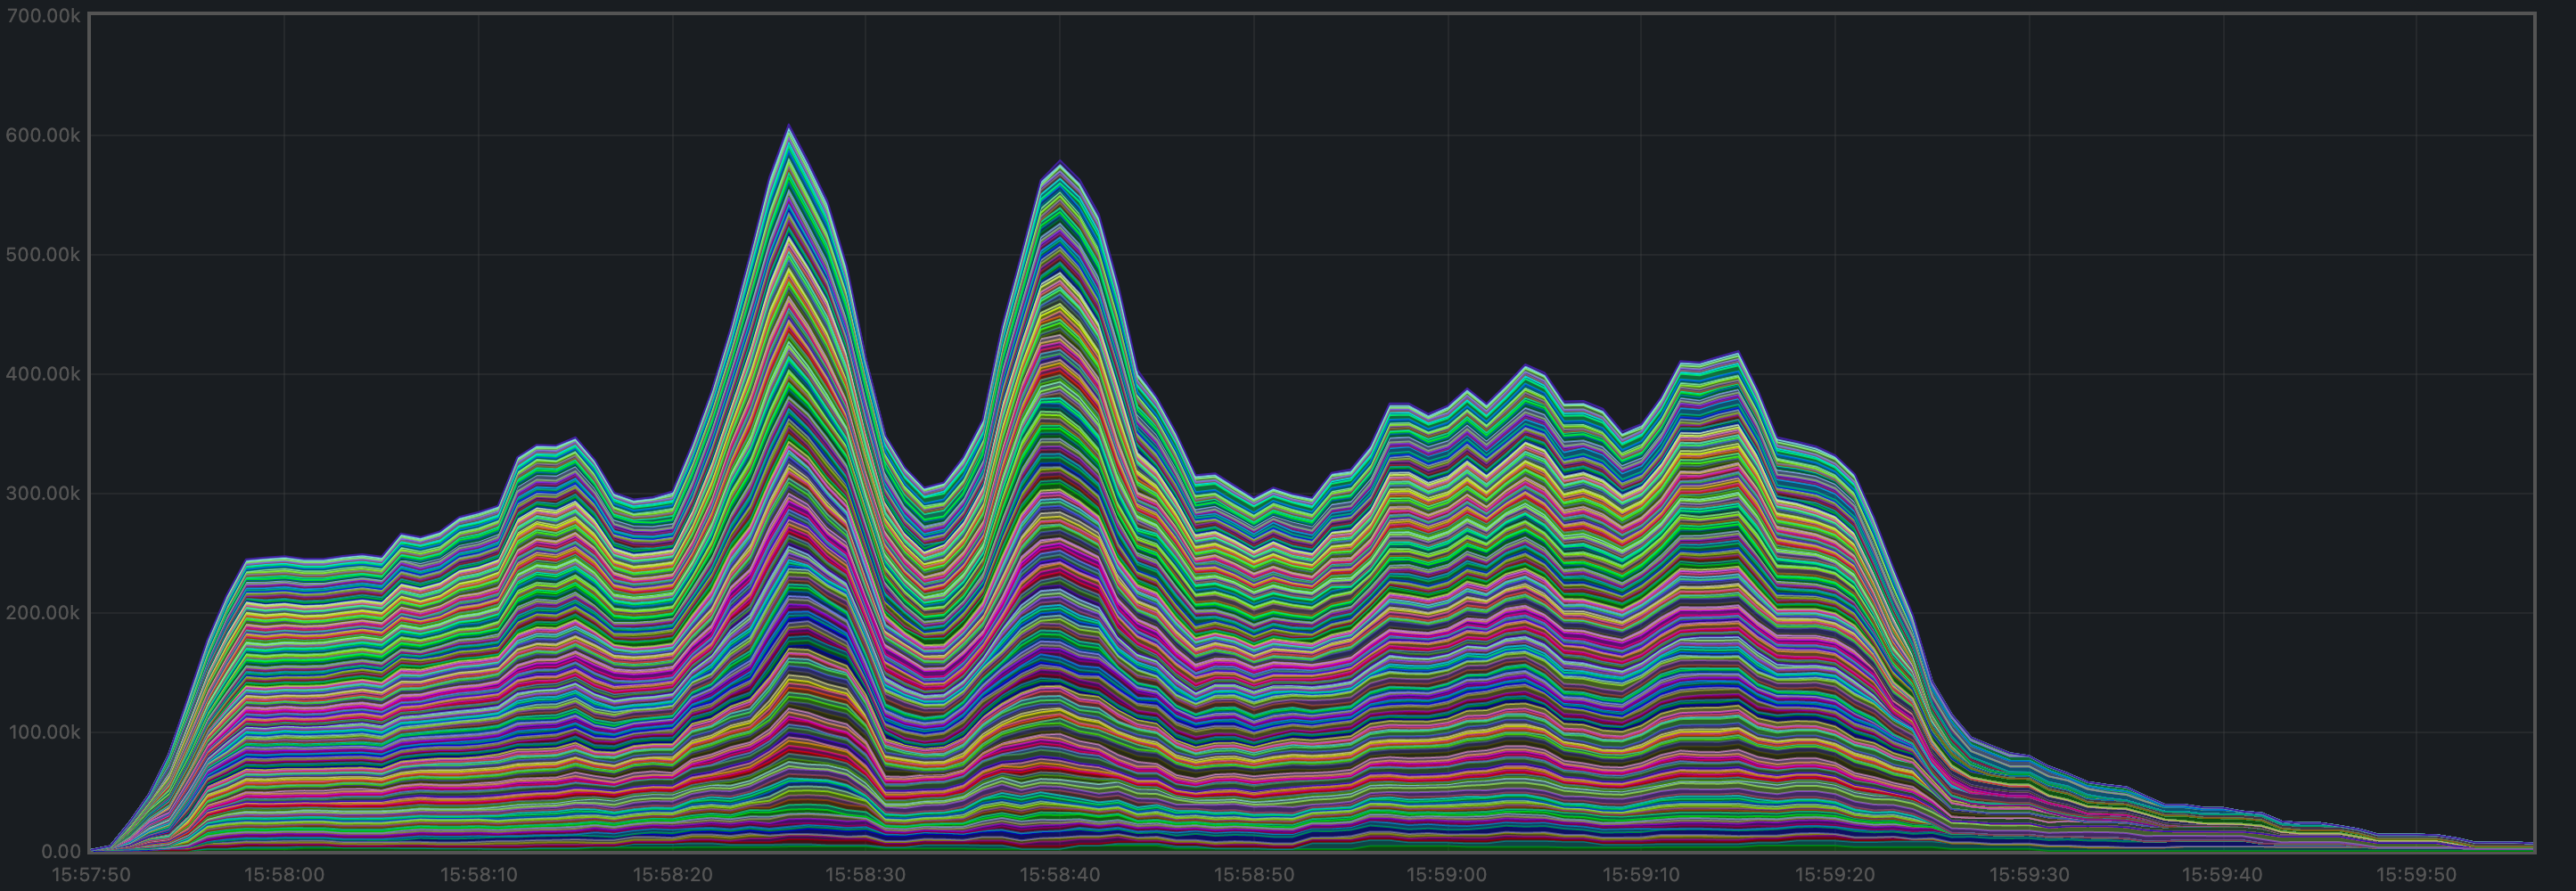 下图展示了所有全节点的平均值,其在 1500 到 2000 笔待处理交易之间波动。
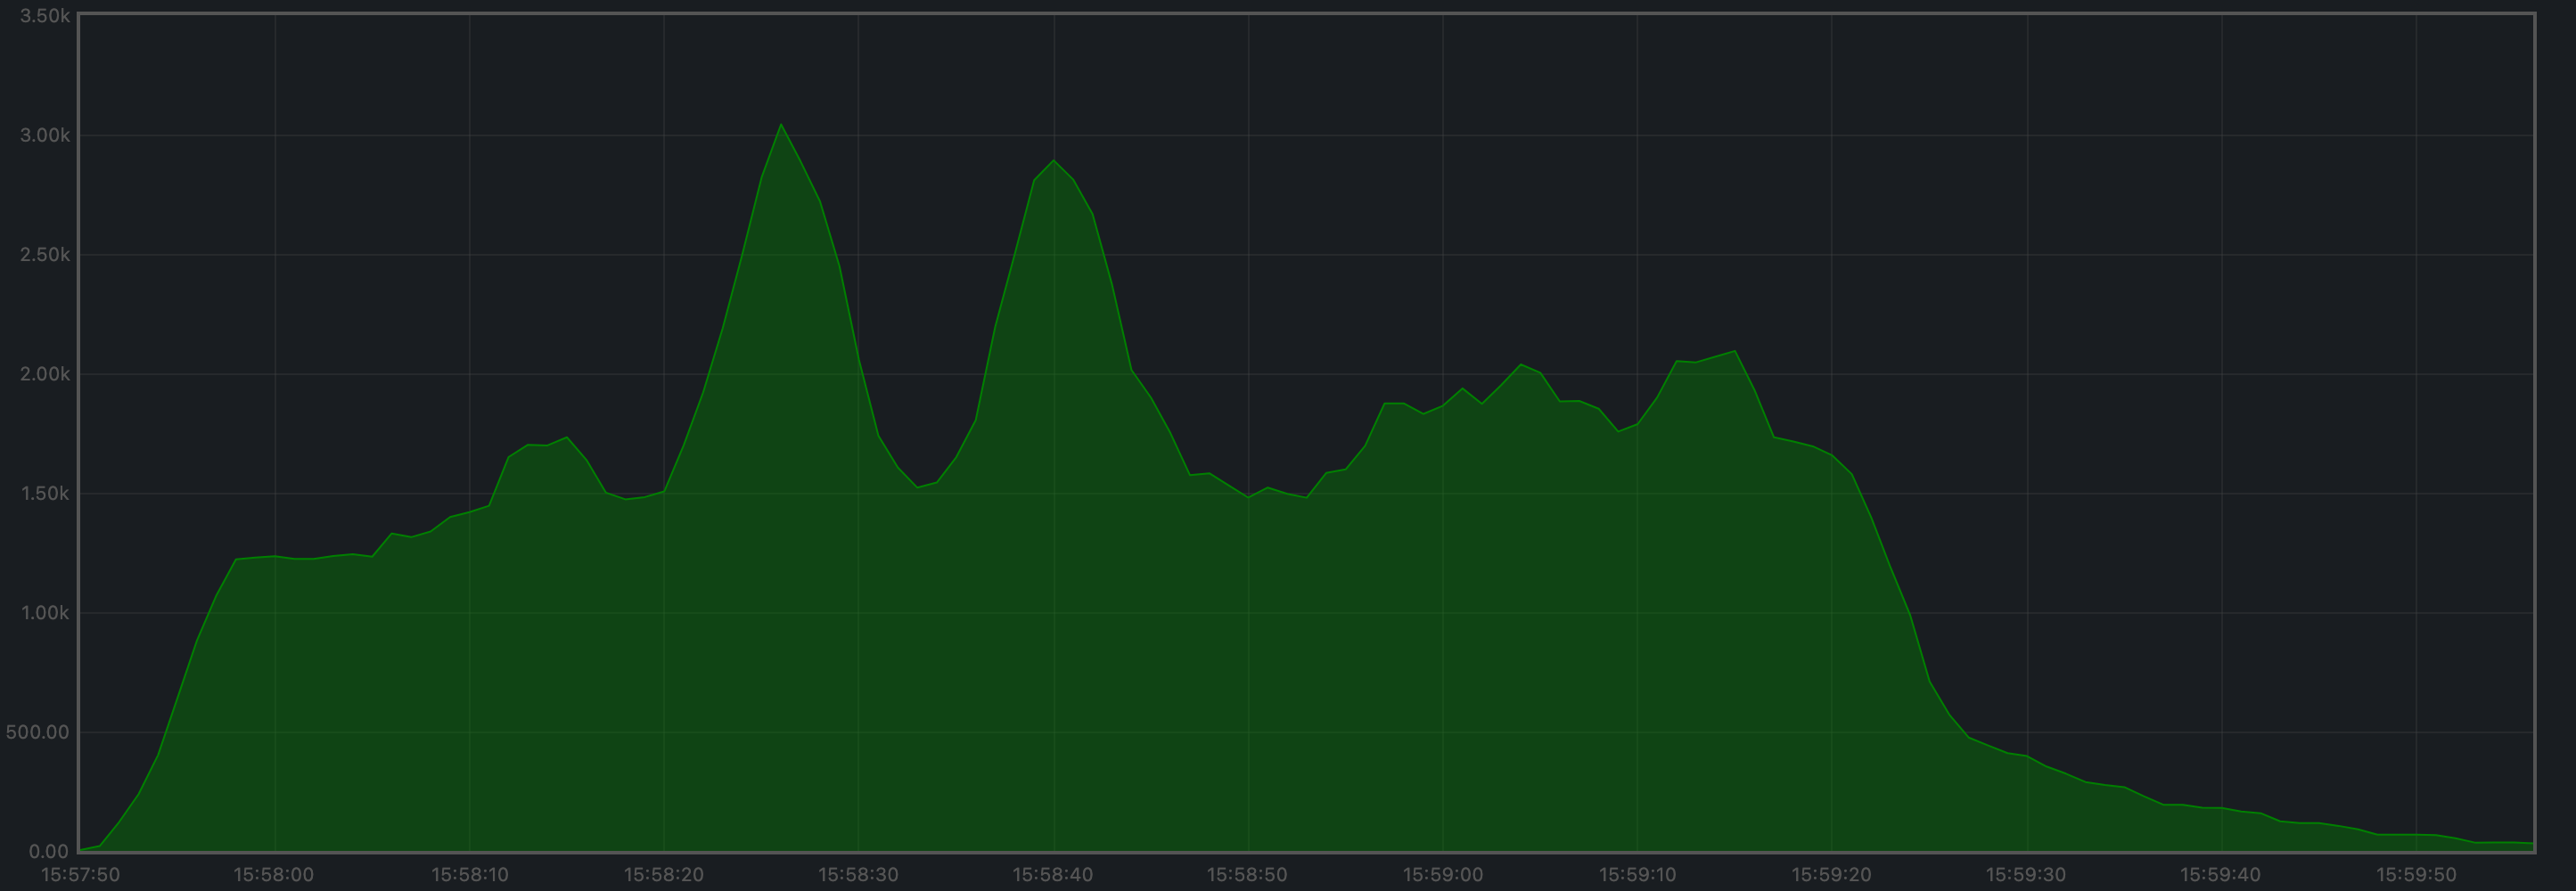 观察到的峰值与部分节点进入共识第 1 轮的时刻一致(见下文)。
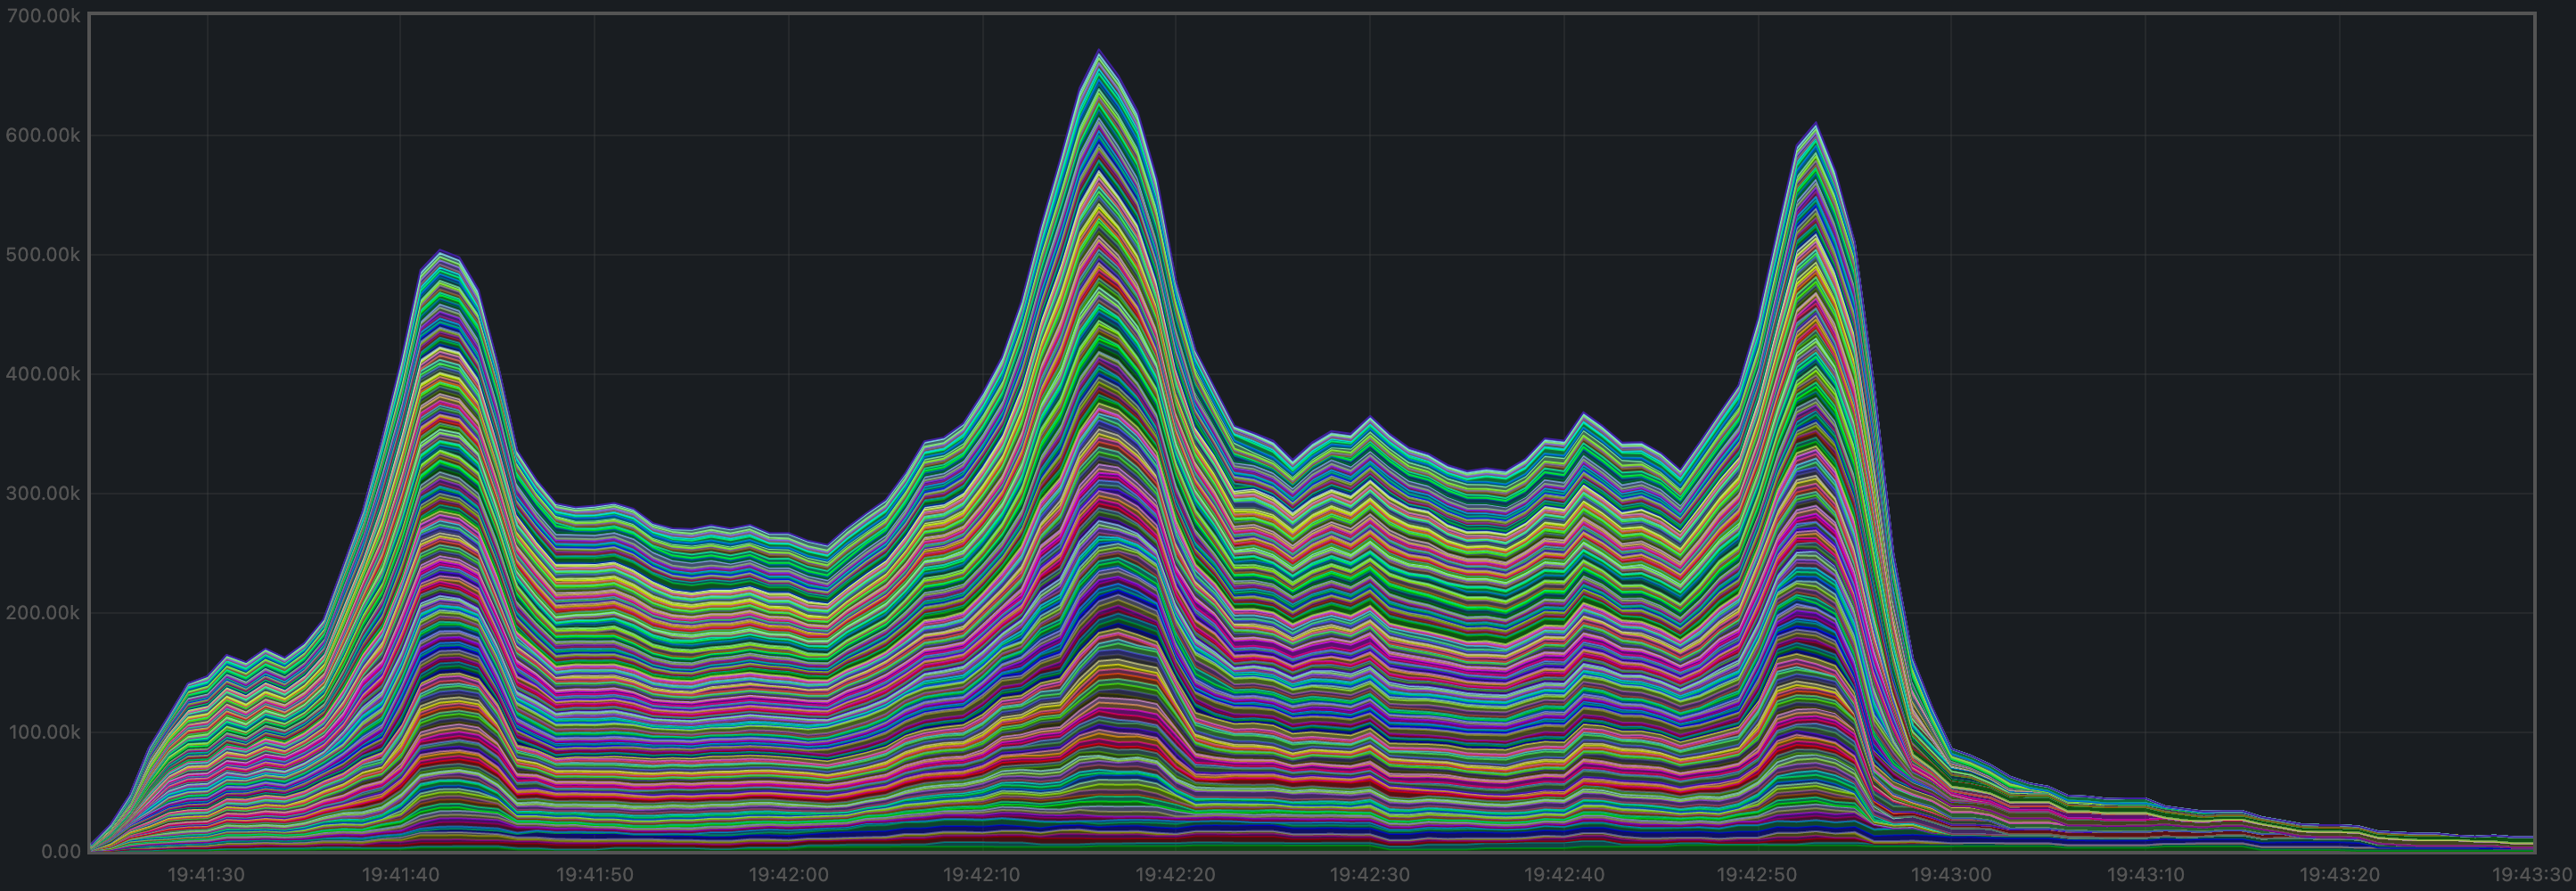
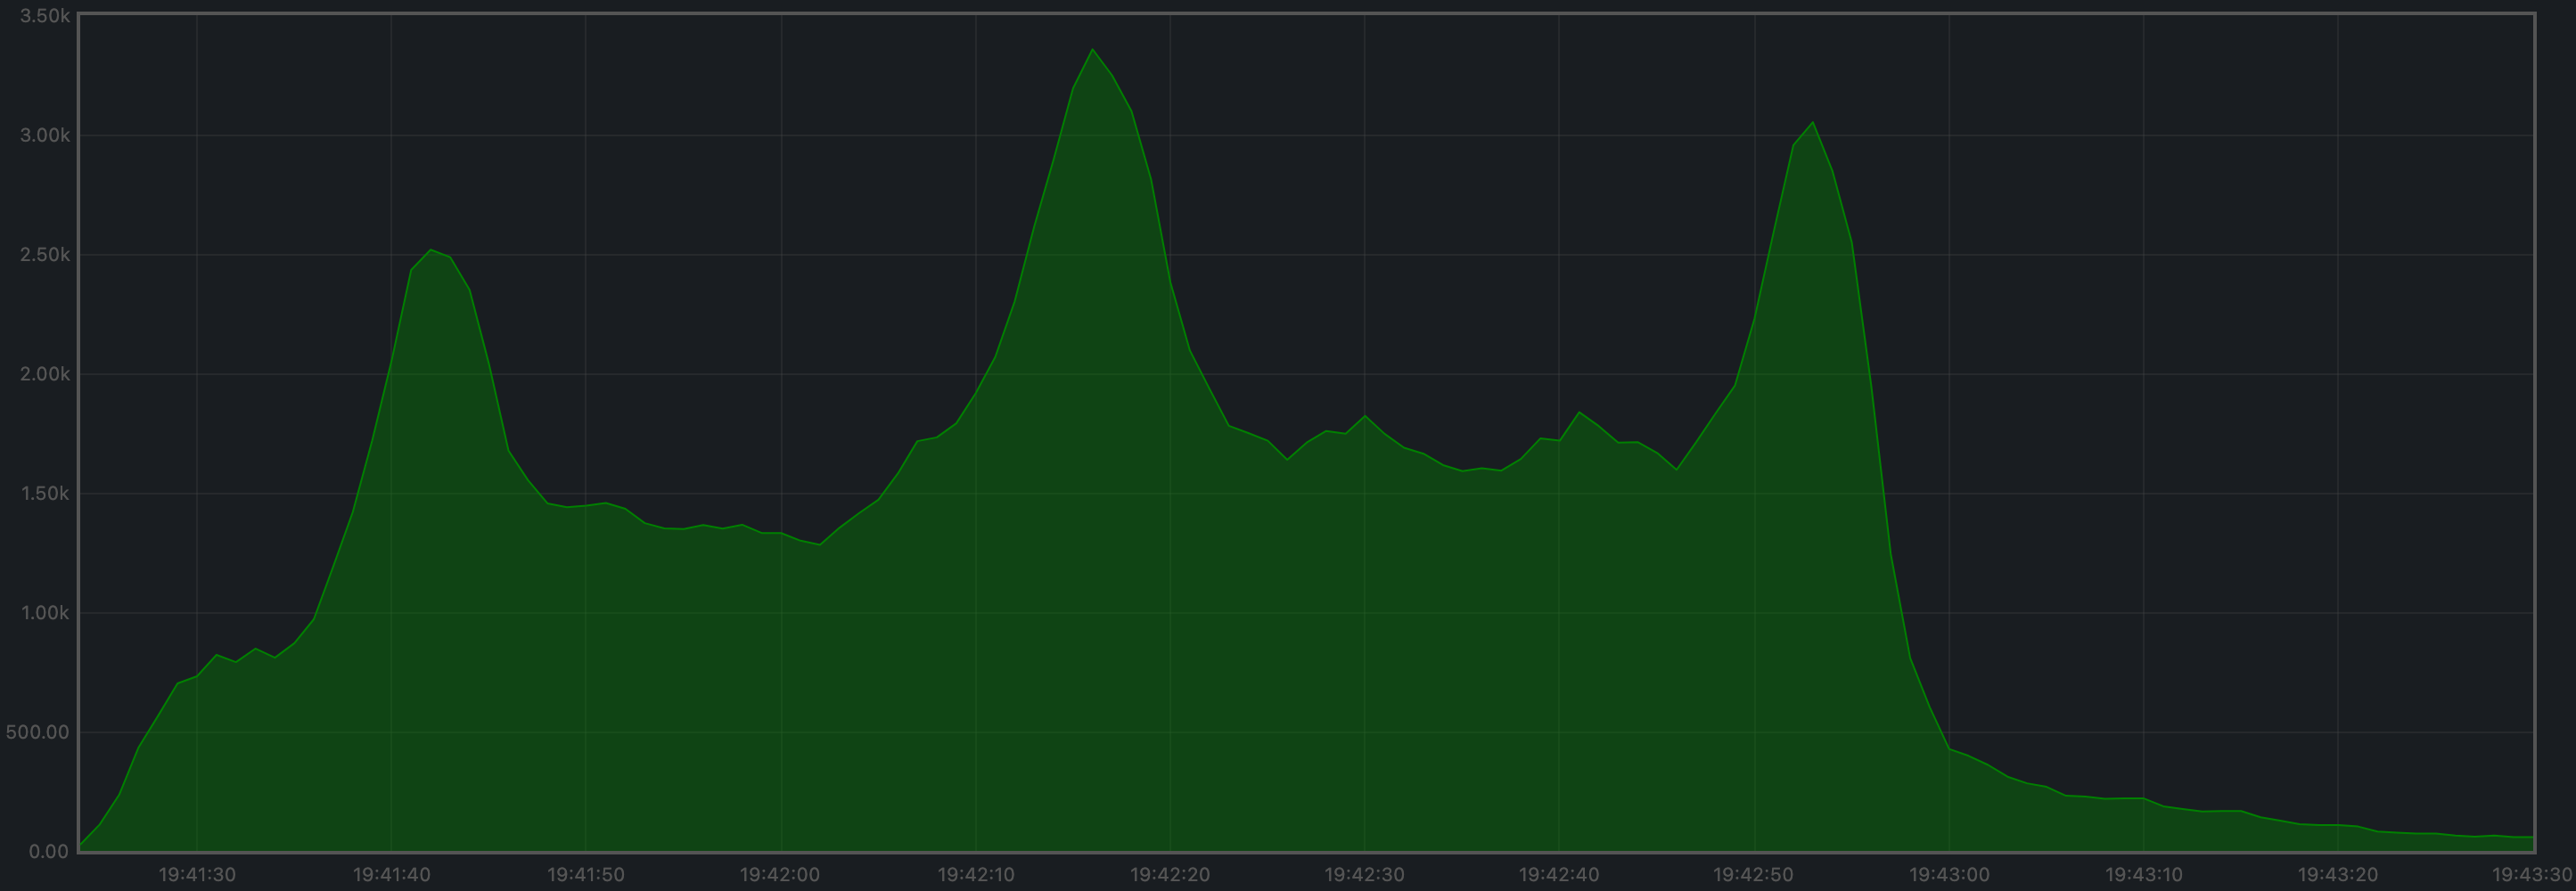
这些图与基线结果相似:
观察到的峰值与部分节点进入共识第 1 轮的时刻一致(见下文)。
这些图与基线结果相似:
对等节点
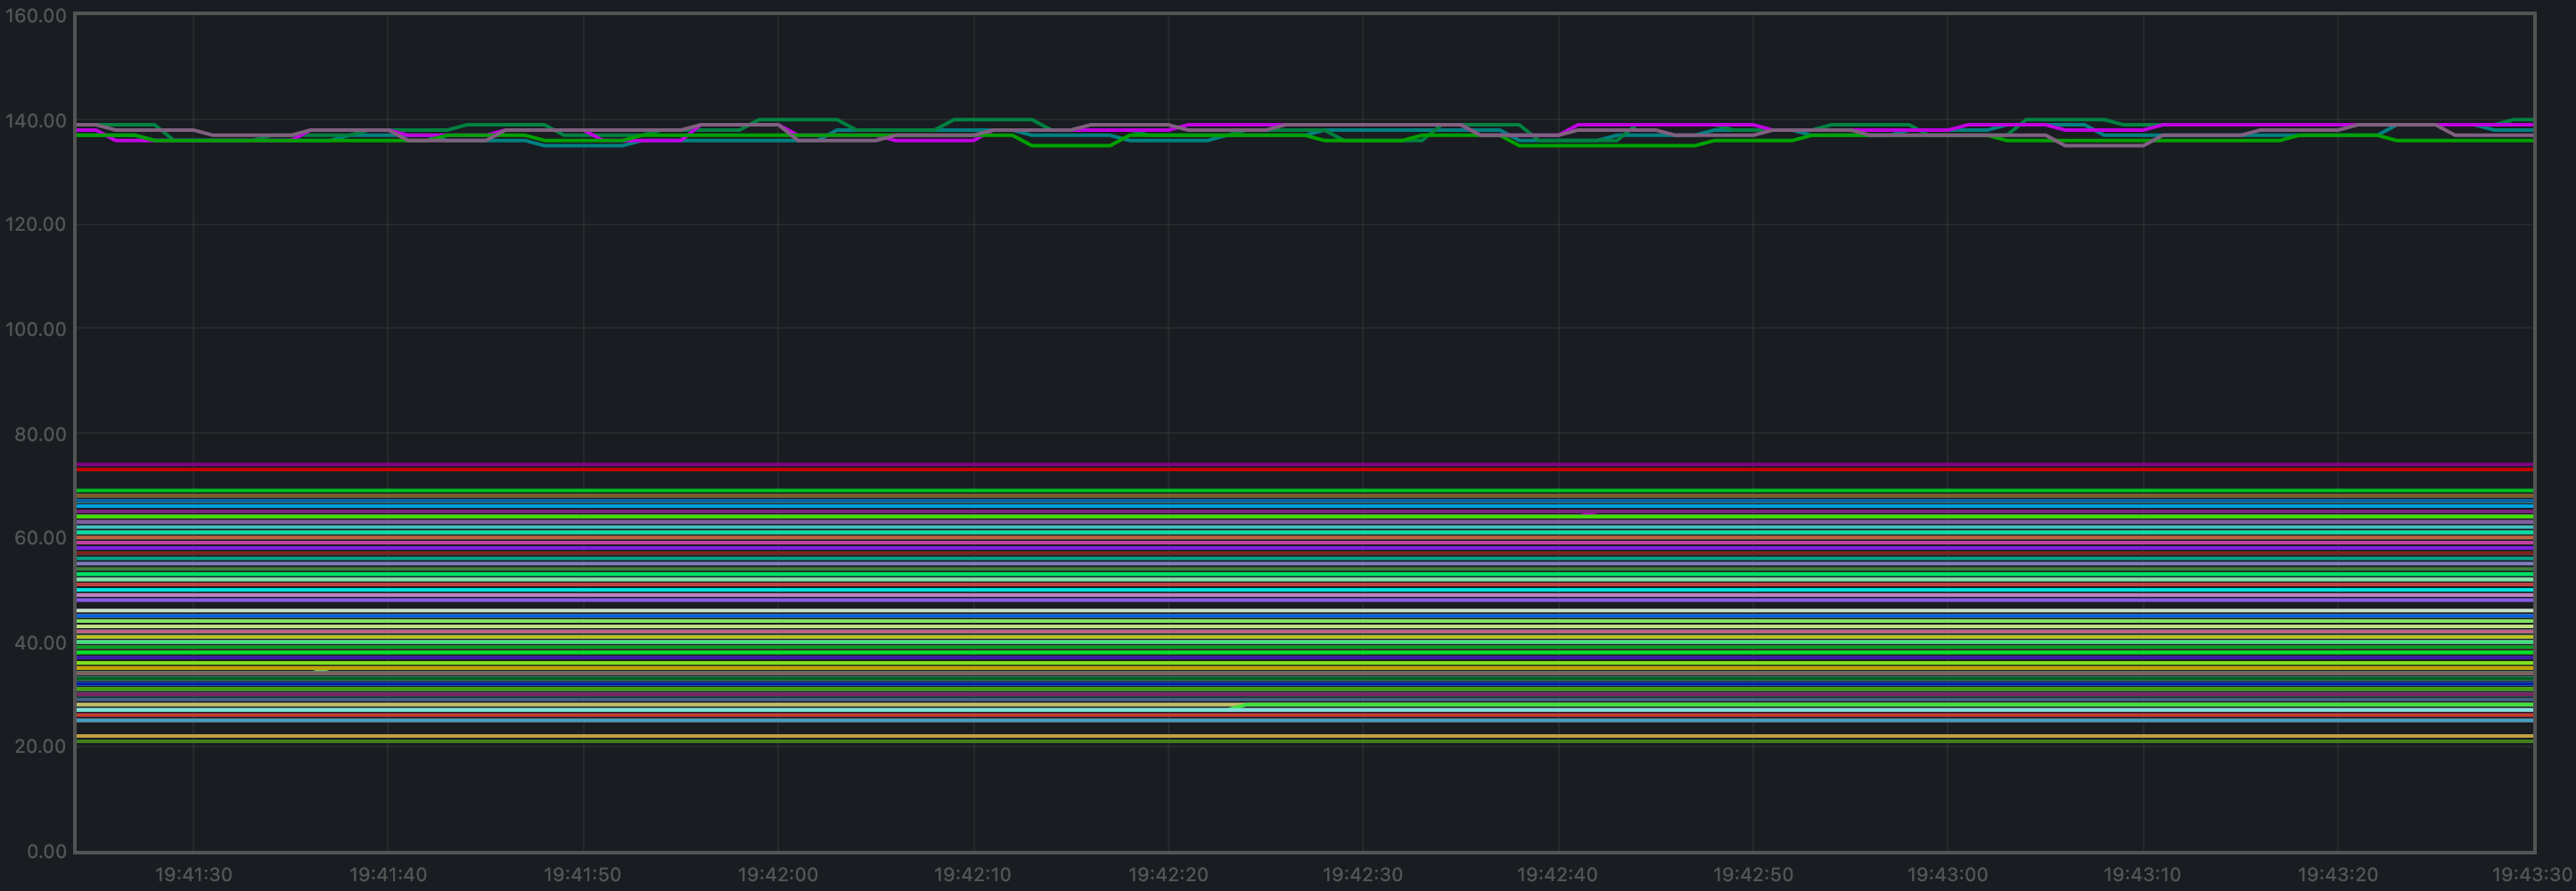
所有节点的对等节点数量都很稳定。 种子节点的数量更高(约 140),其余节点则在 16 到 78 之间。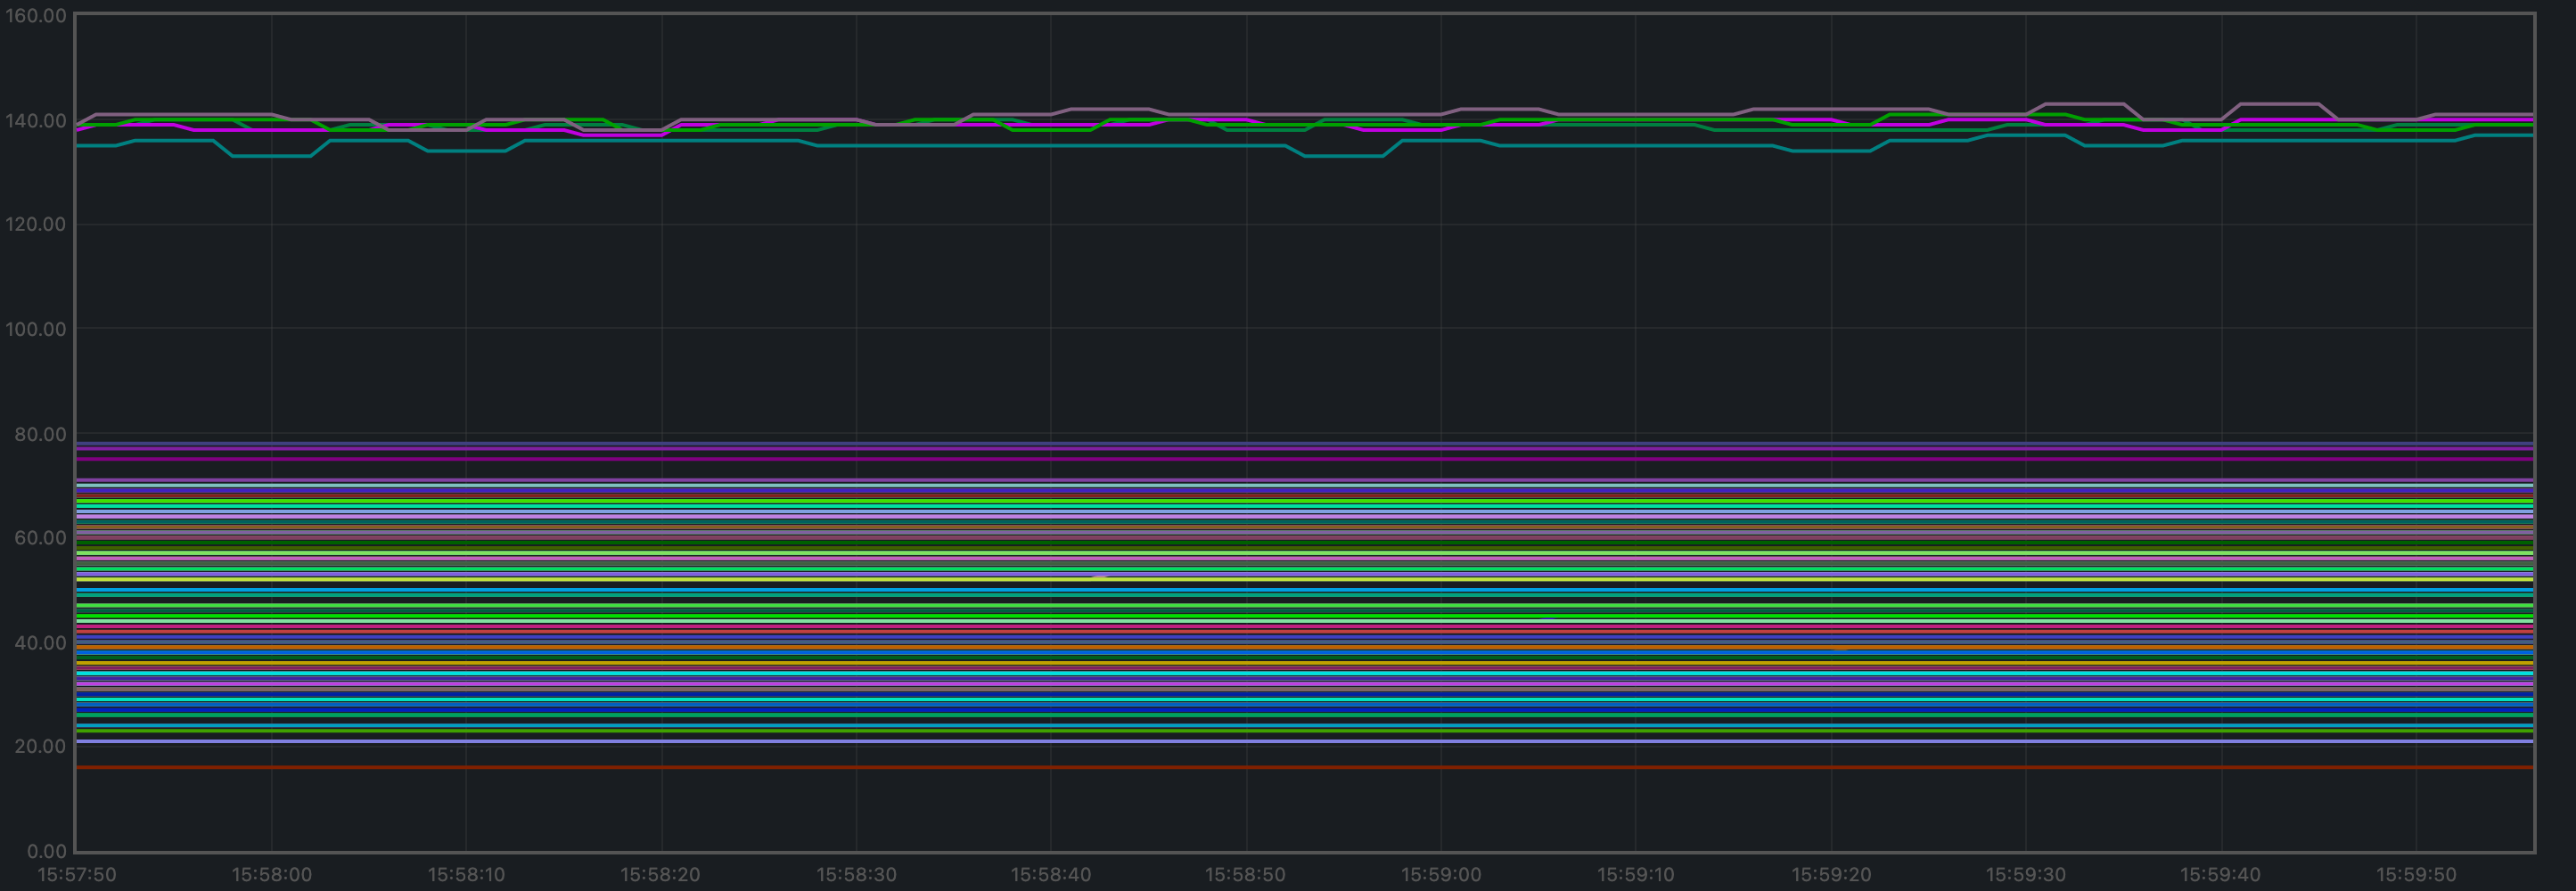 与基线一样,非种子节点超过 50 个对等节点这一现象是由 #9548 导致的。
该图与基线结果相似:
与基线一样,非种子节点超过 50 个对等节点这一现象是由 #9548 导致的。
该图与基线结果相似:
每个高度的共识轮次
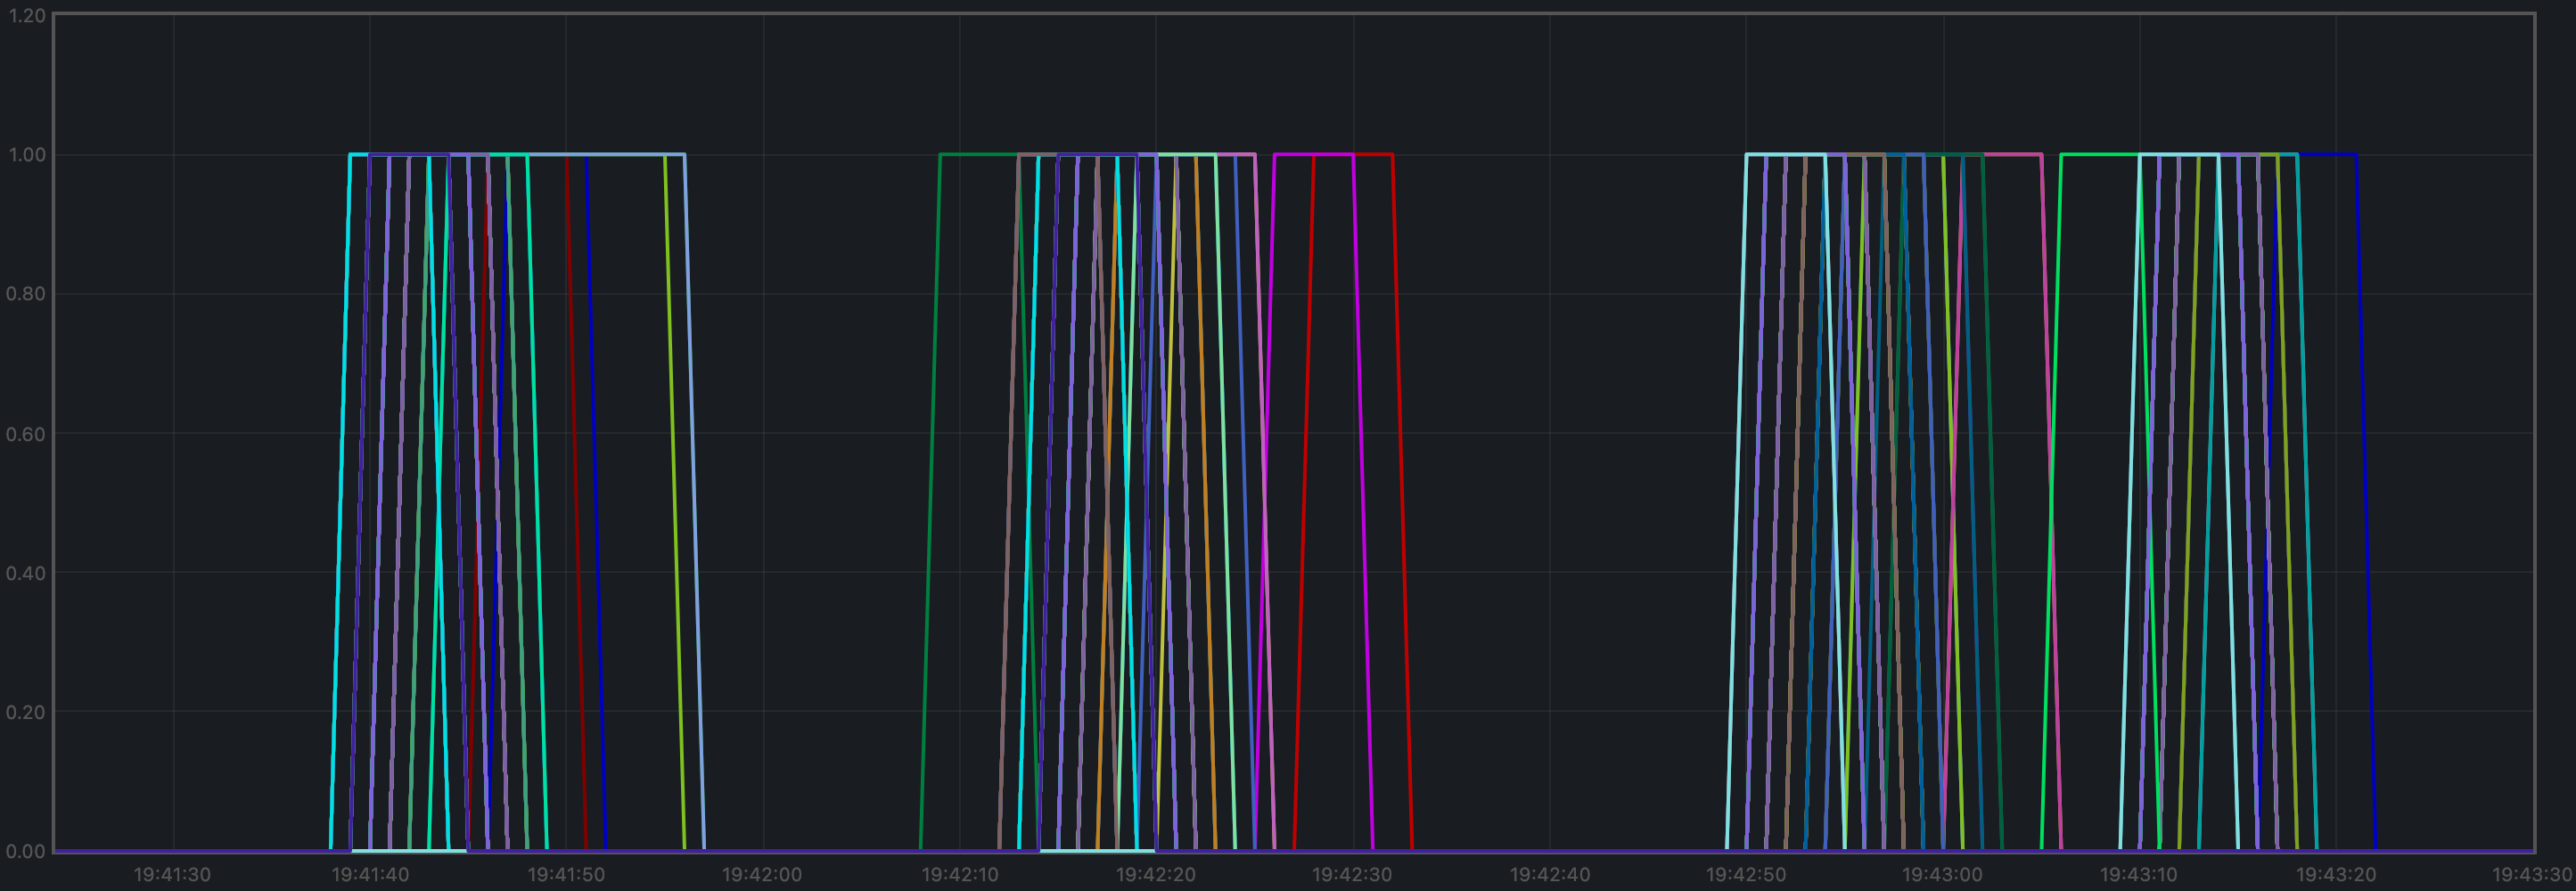
大多数高度只需一轮,但有些节点在某些时刻需要推进到第 1 轮。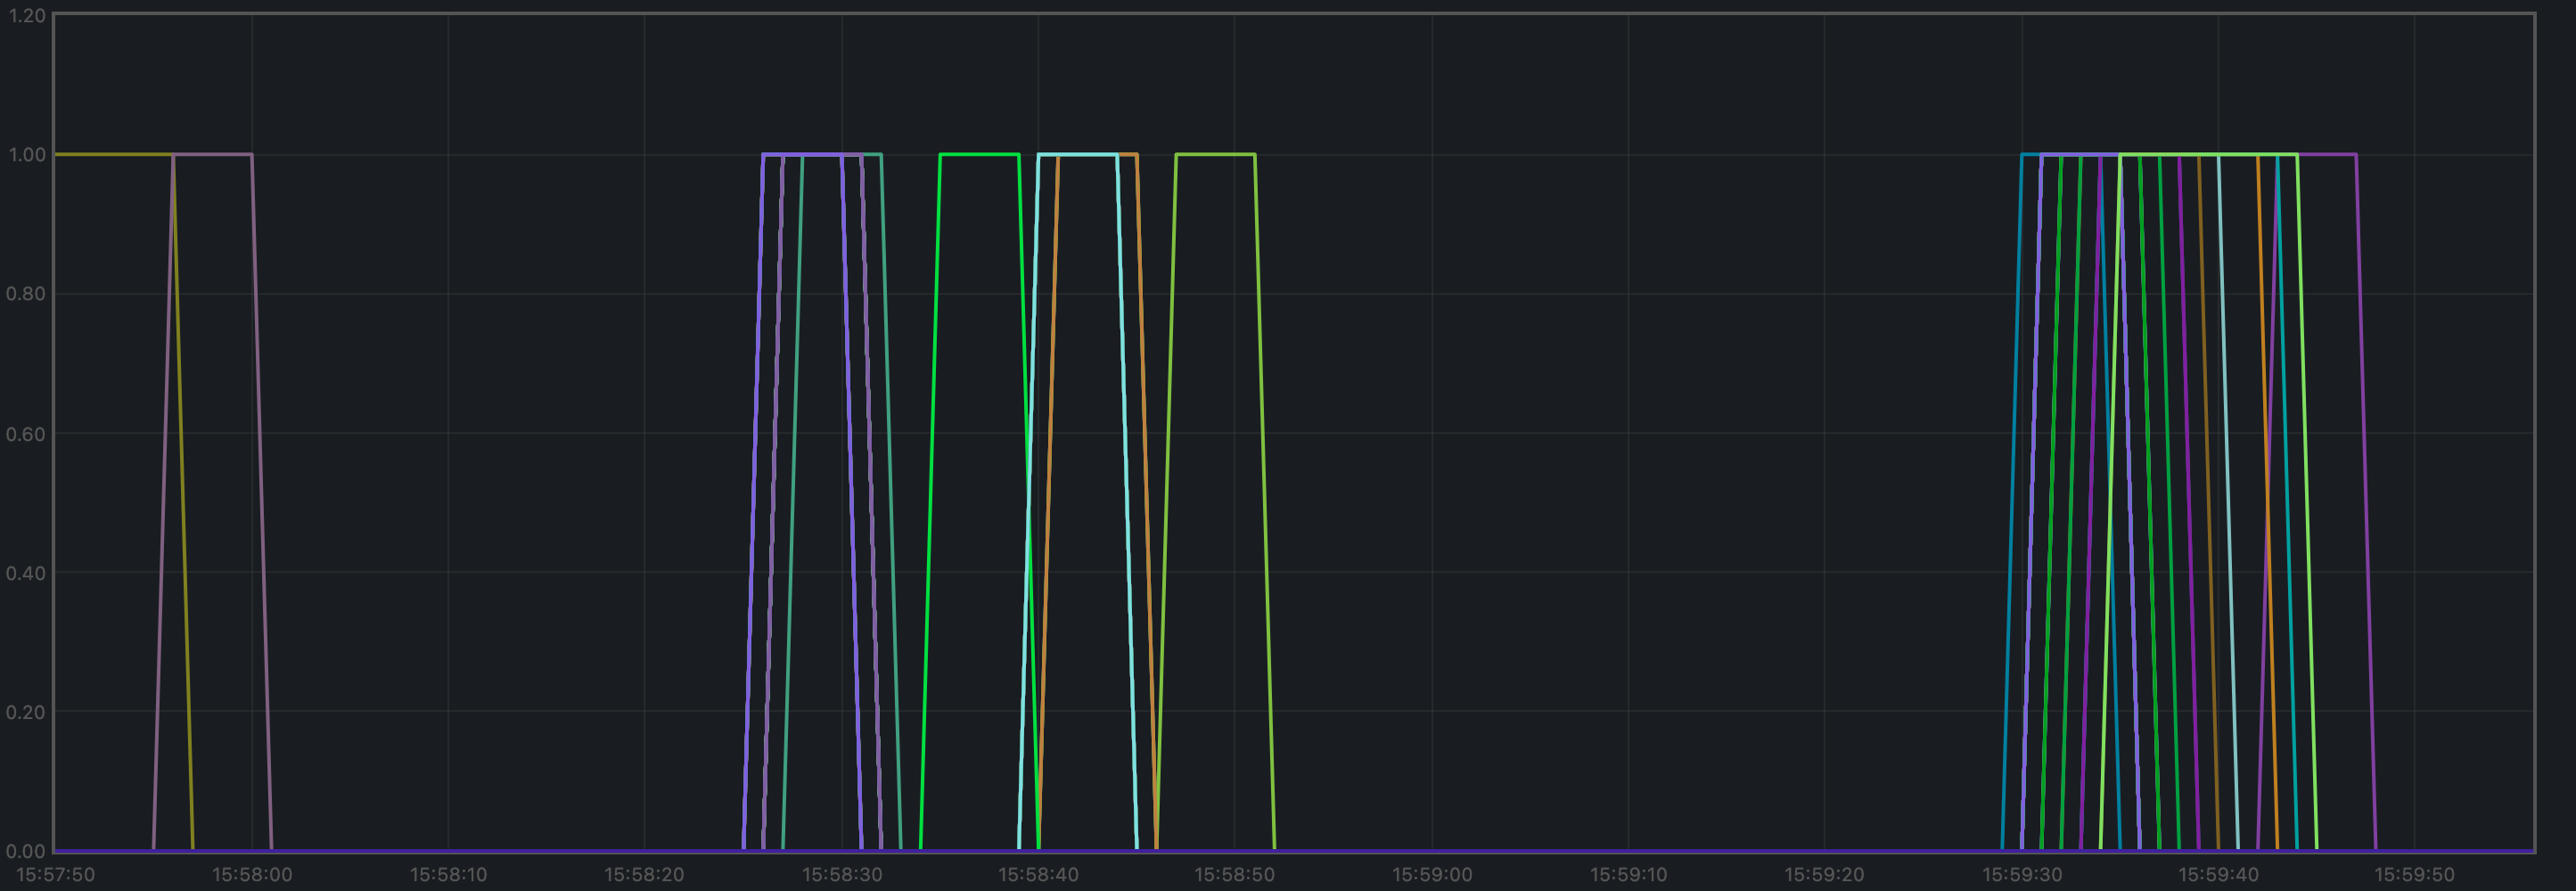 该图结果略优于基线:
每分钟产生的区块数、每分钟处理的交易数
每分钟产生的区块数就是下图的斜率。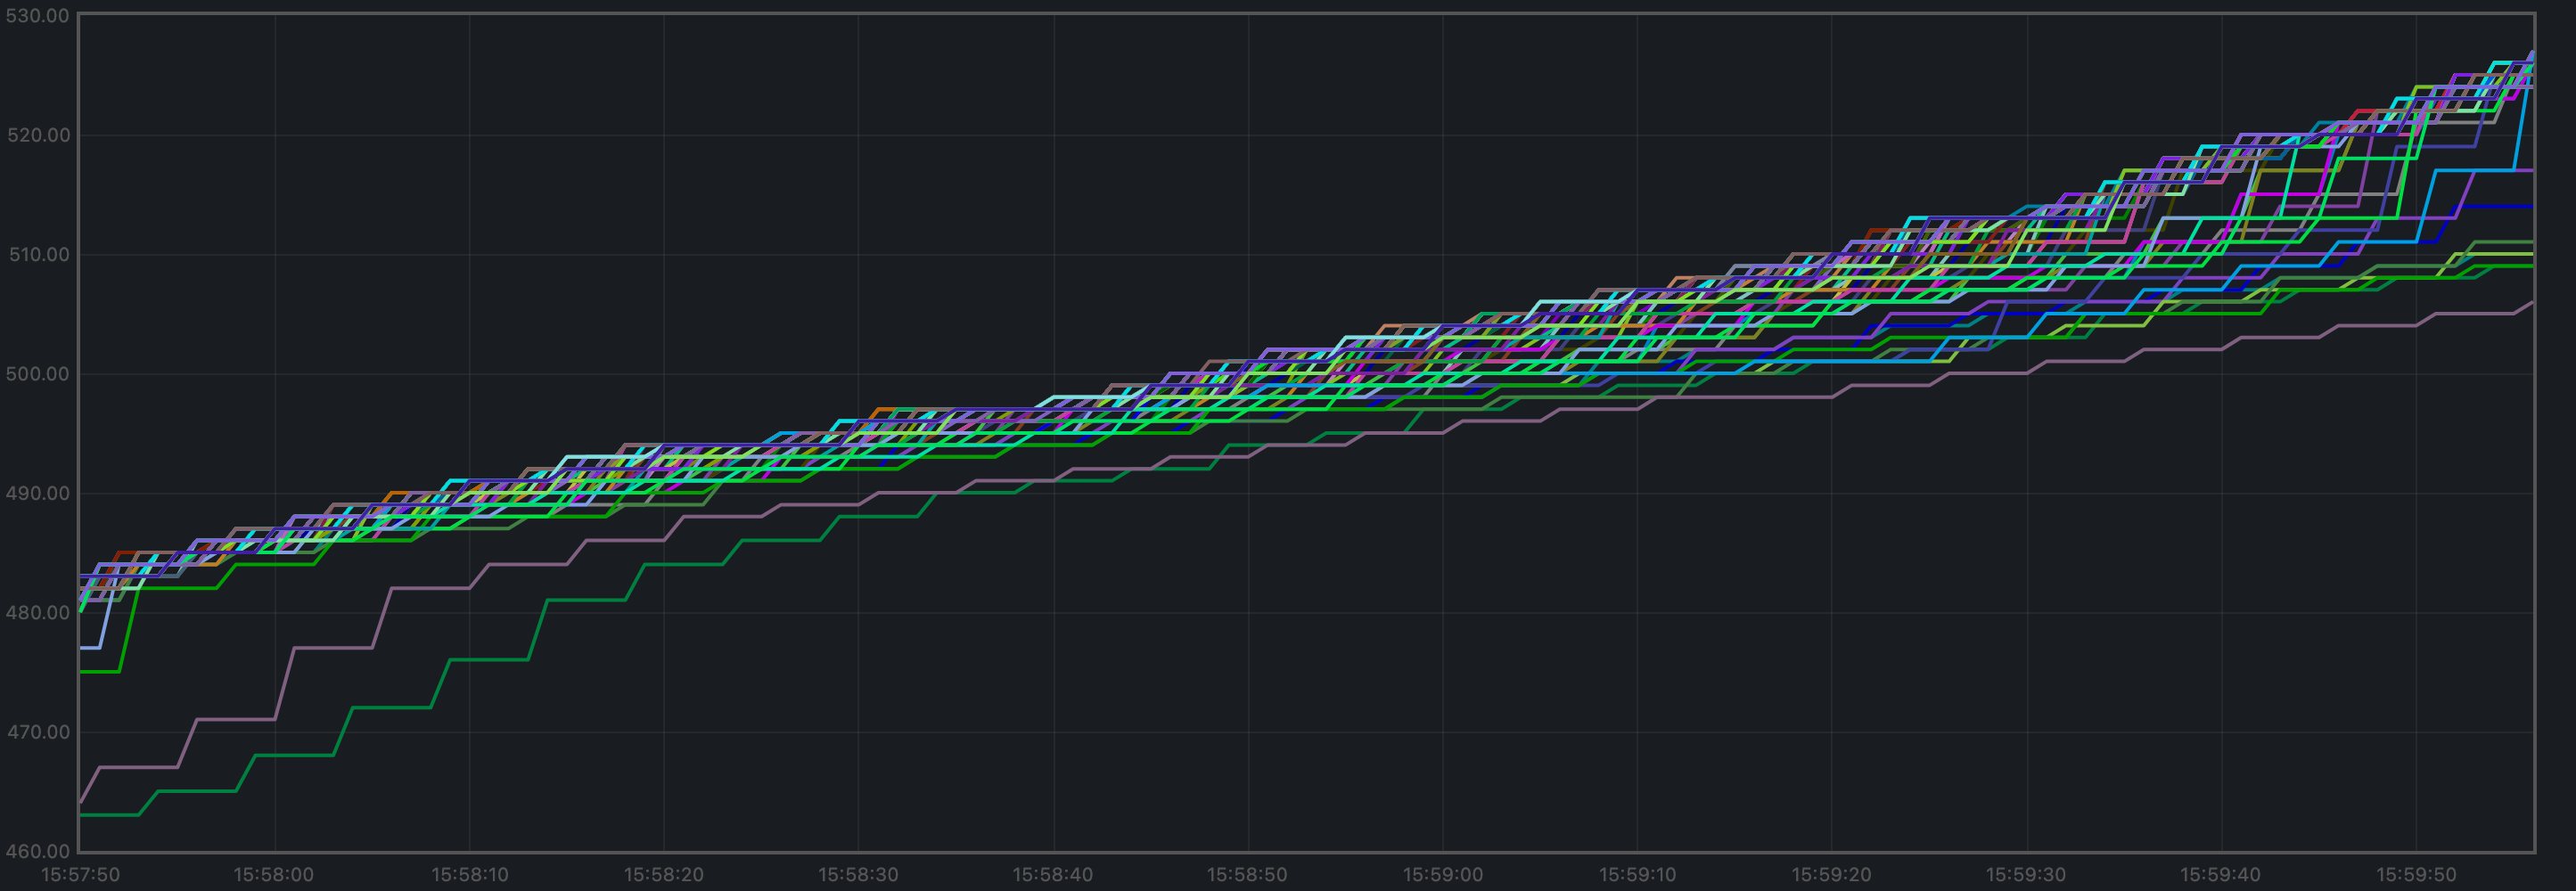 在 2 分钟时间内,高度从 477 增长到 524。
由此可得平均每分钟产生 23.5 个区块。
每分钟处理的交易数就是下图的斜率。
在 2 分钟时间内,高度从 477 增长到 524。
由此可得平均每分钟产生 23.5 个区块。
每分钟处理的交易数就是下图的斜率。
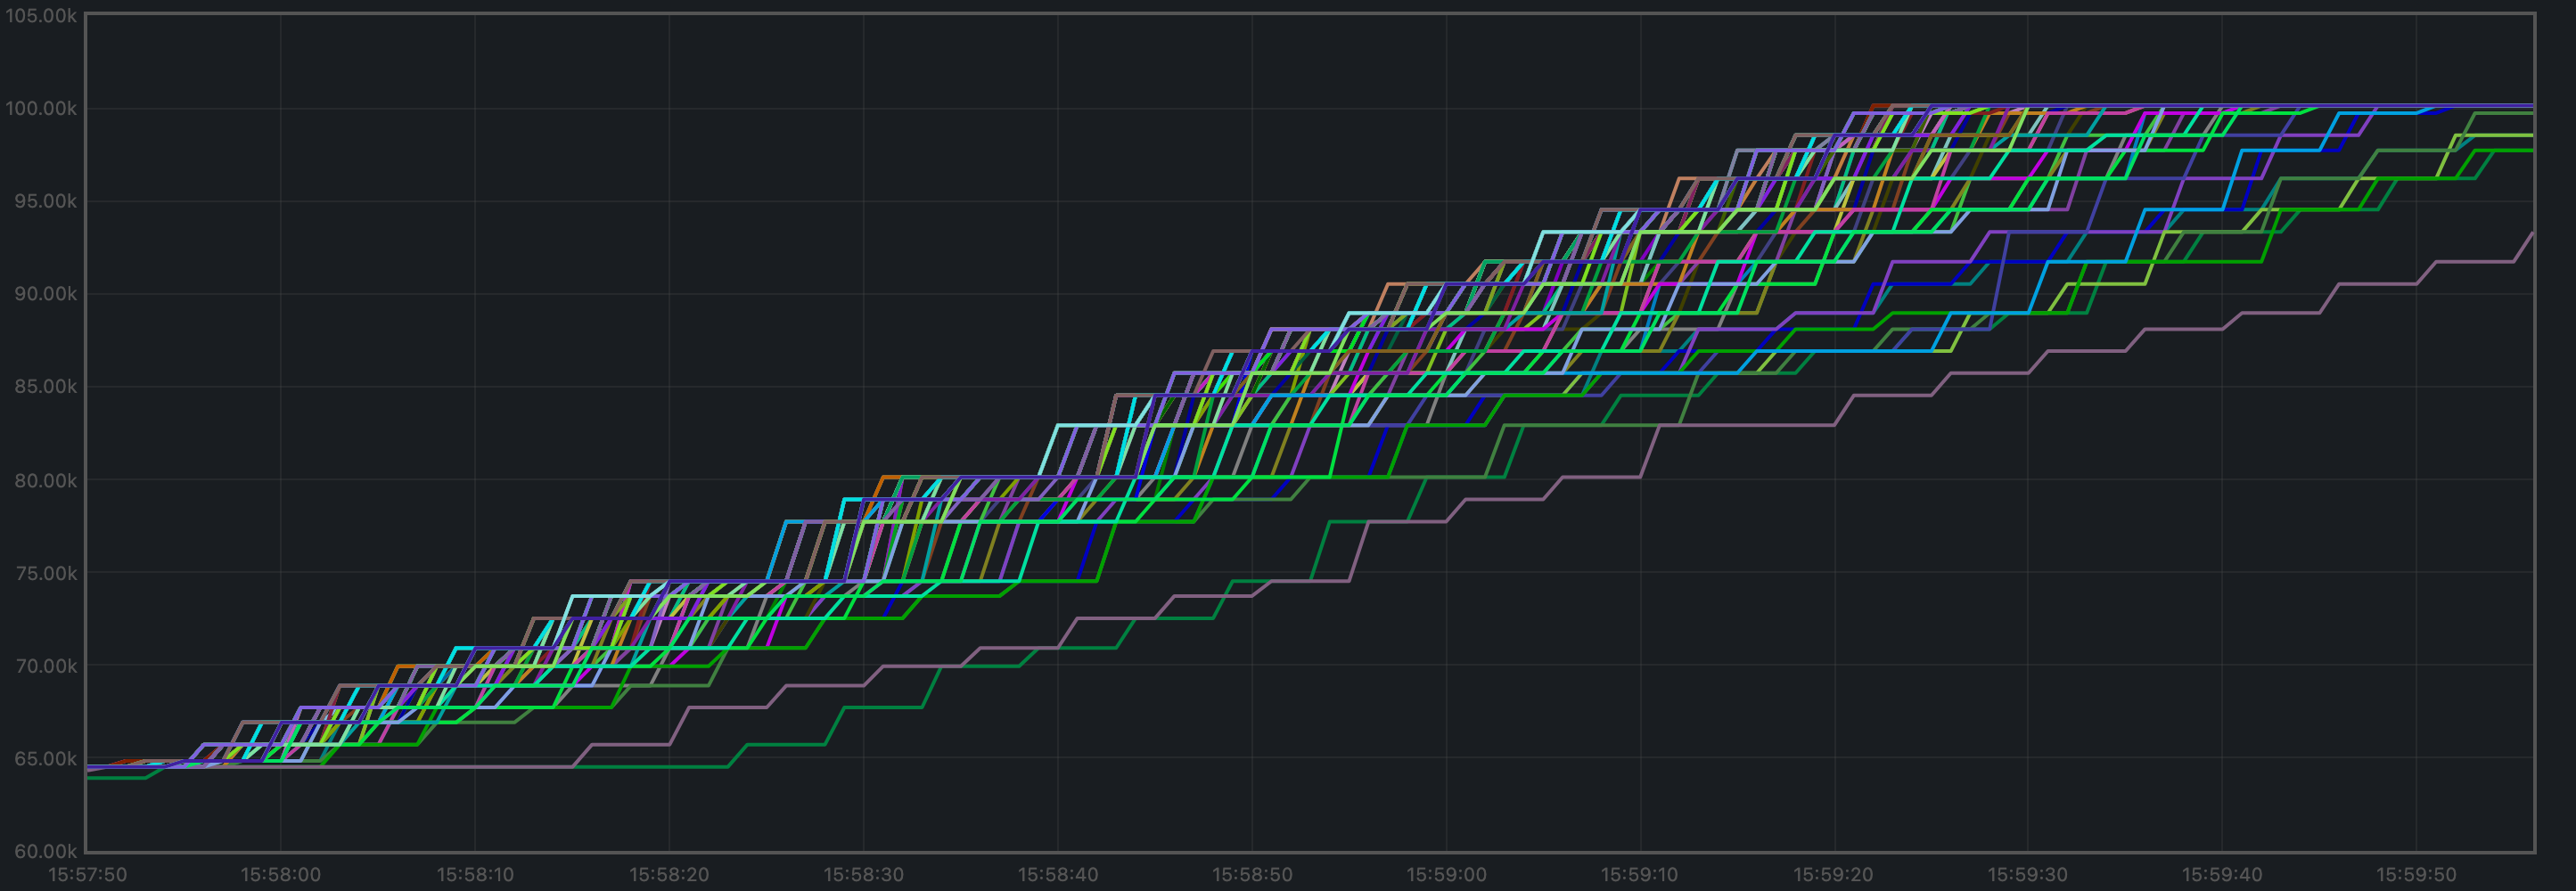 在 2 分钟时间内,交易总数从 64525 增长到 100125,
得到每分钟 17800 笔交易。不过,从图中可以看出,
负载中的所有交易在两分钟之前很早就已经处理完成。
如果将时间窗口调整为交易实际处理的区间(约 90 秒),
则可得到每分钟 23733 笔交易。
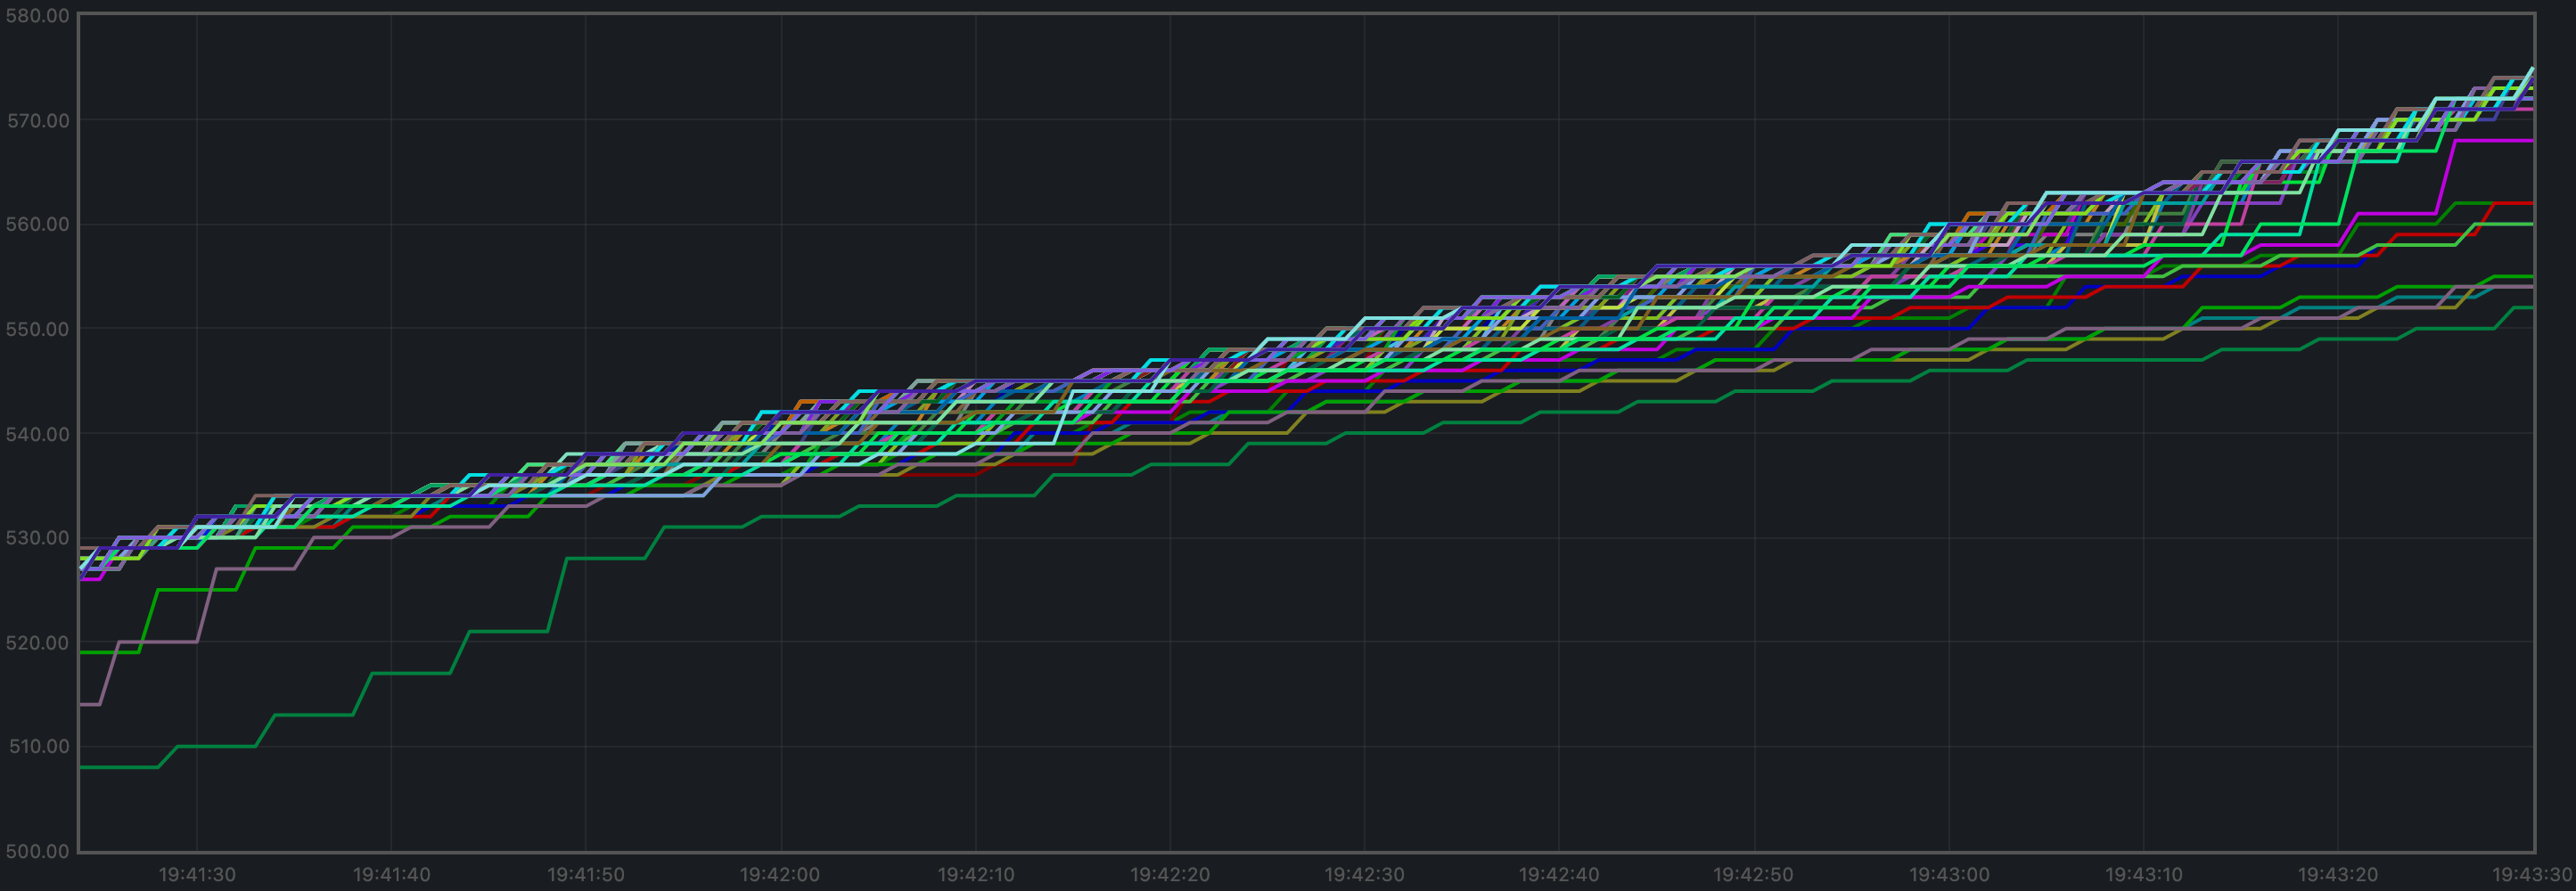
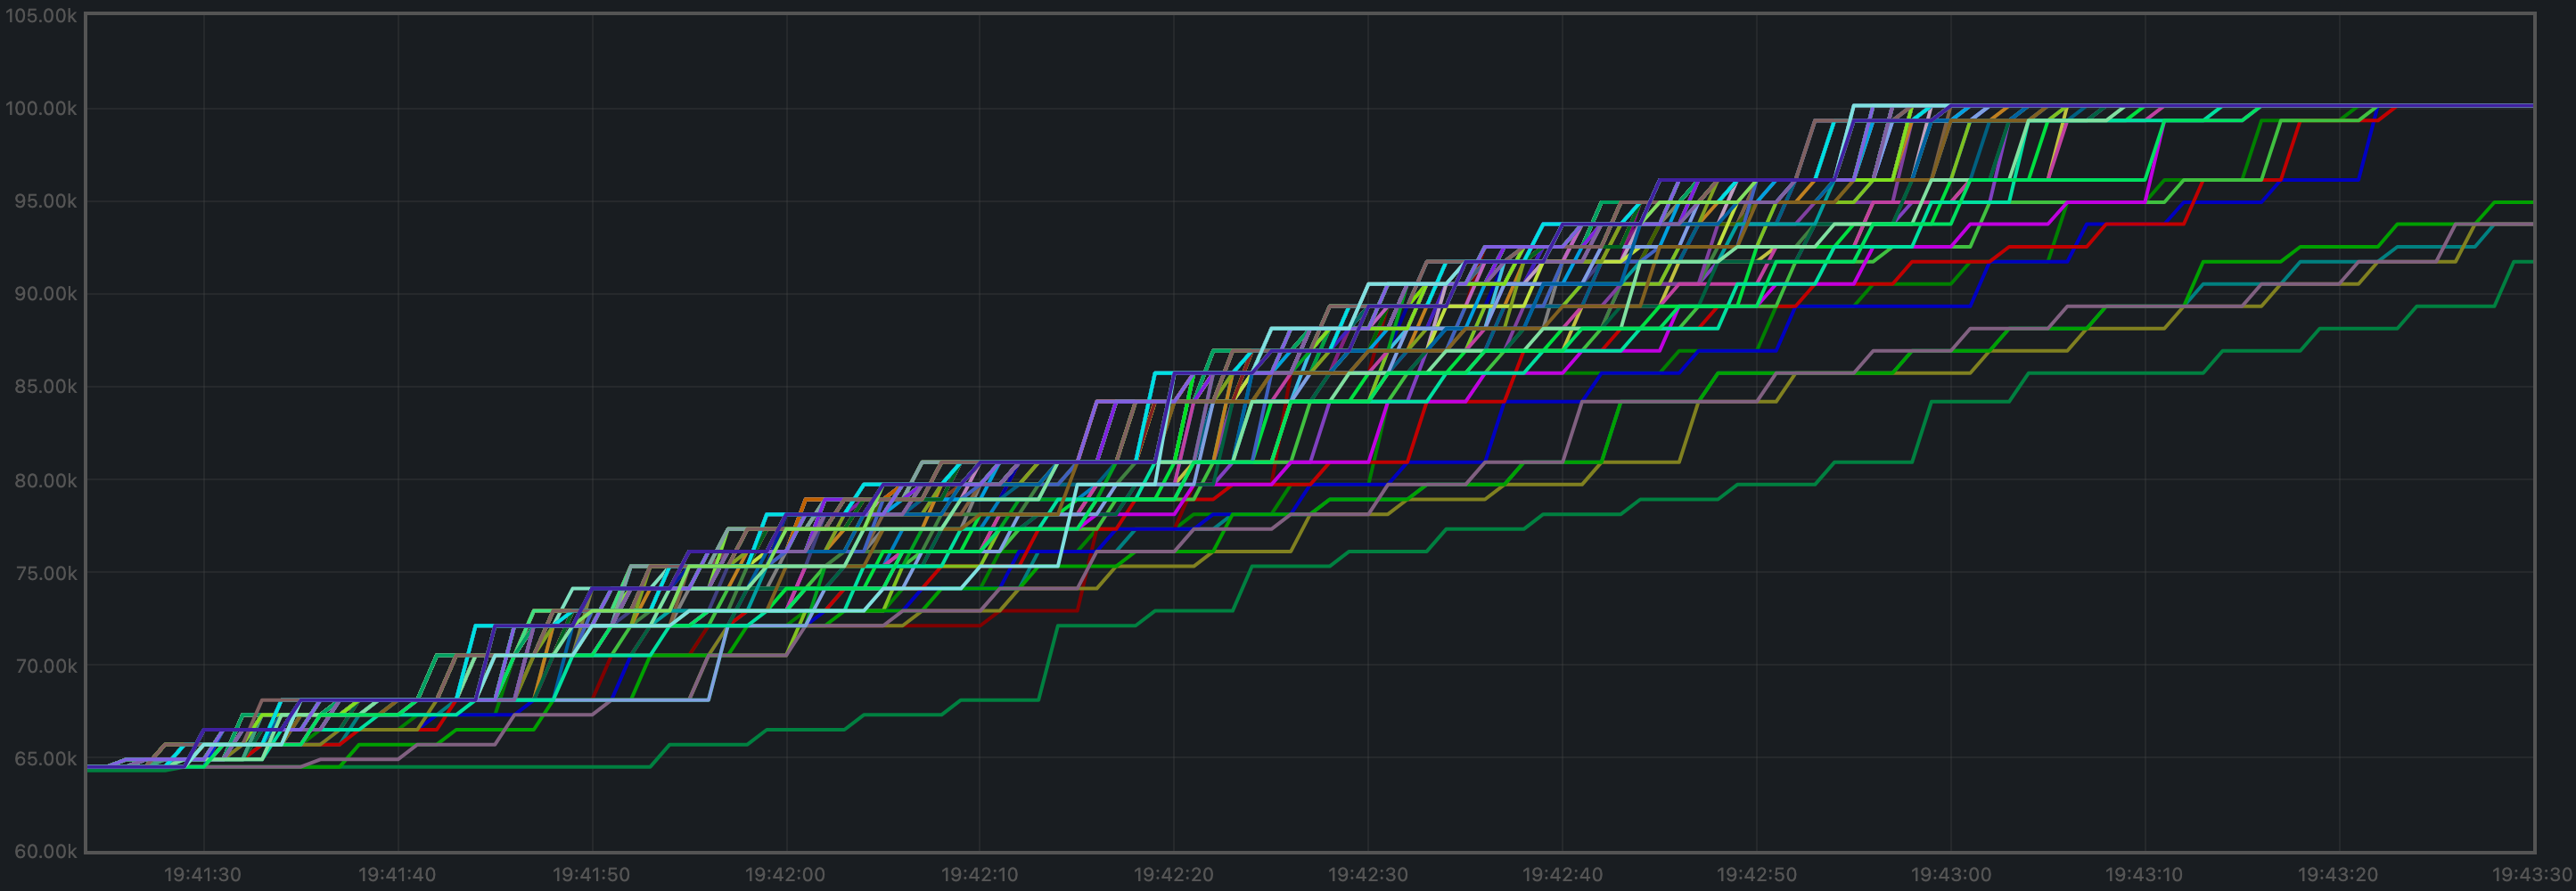
这些图与基线结果相似:
在 2 分钟时间内,交易总数从 64525 增长到 100125,
得到每分钟 17800 笔交易。不过,从图中可以看出,
负载中的所有交易在两分钟之前很早就已经处理完成。
如果将时间窗口调整为交易实际处理的区间(约 90 秒),
则可得到每分钟 23733 笔交易。
这些图与基线结果相似:
常驻集大小
下图展示了所有受监控进程的常驻集大小(Resident Set Size,RSS)。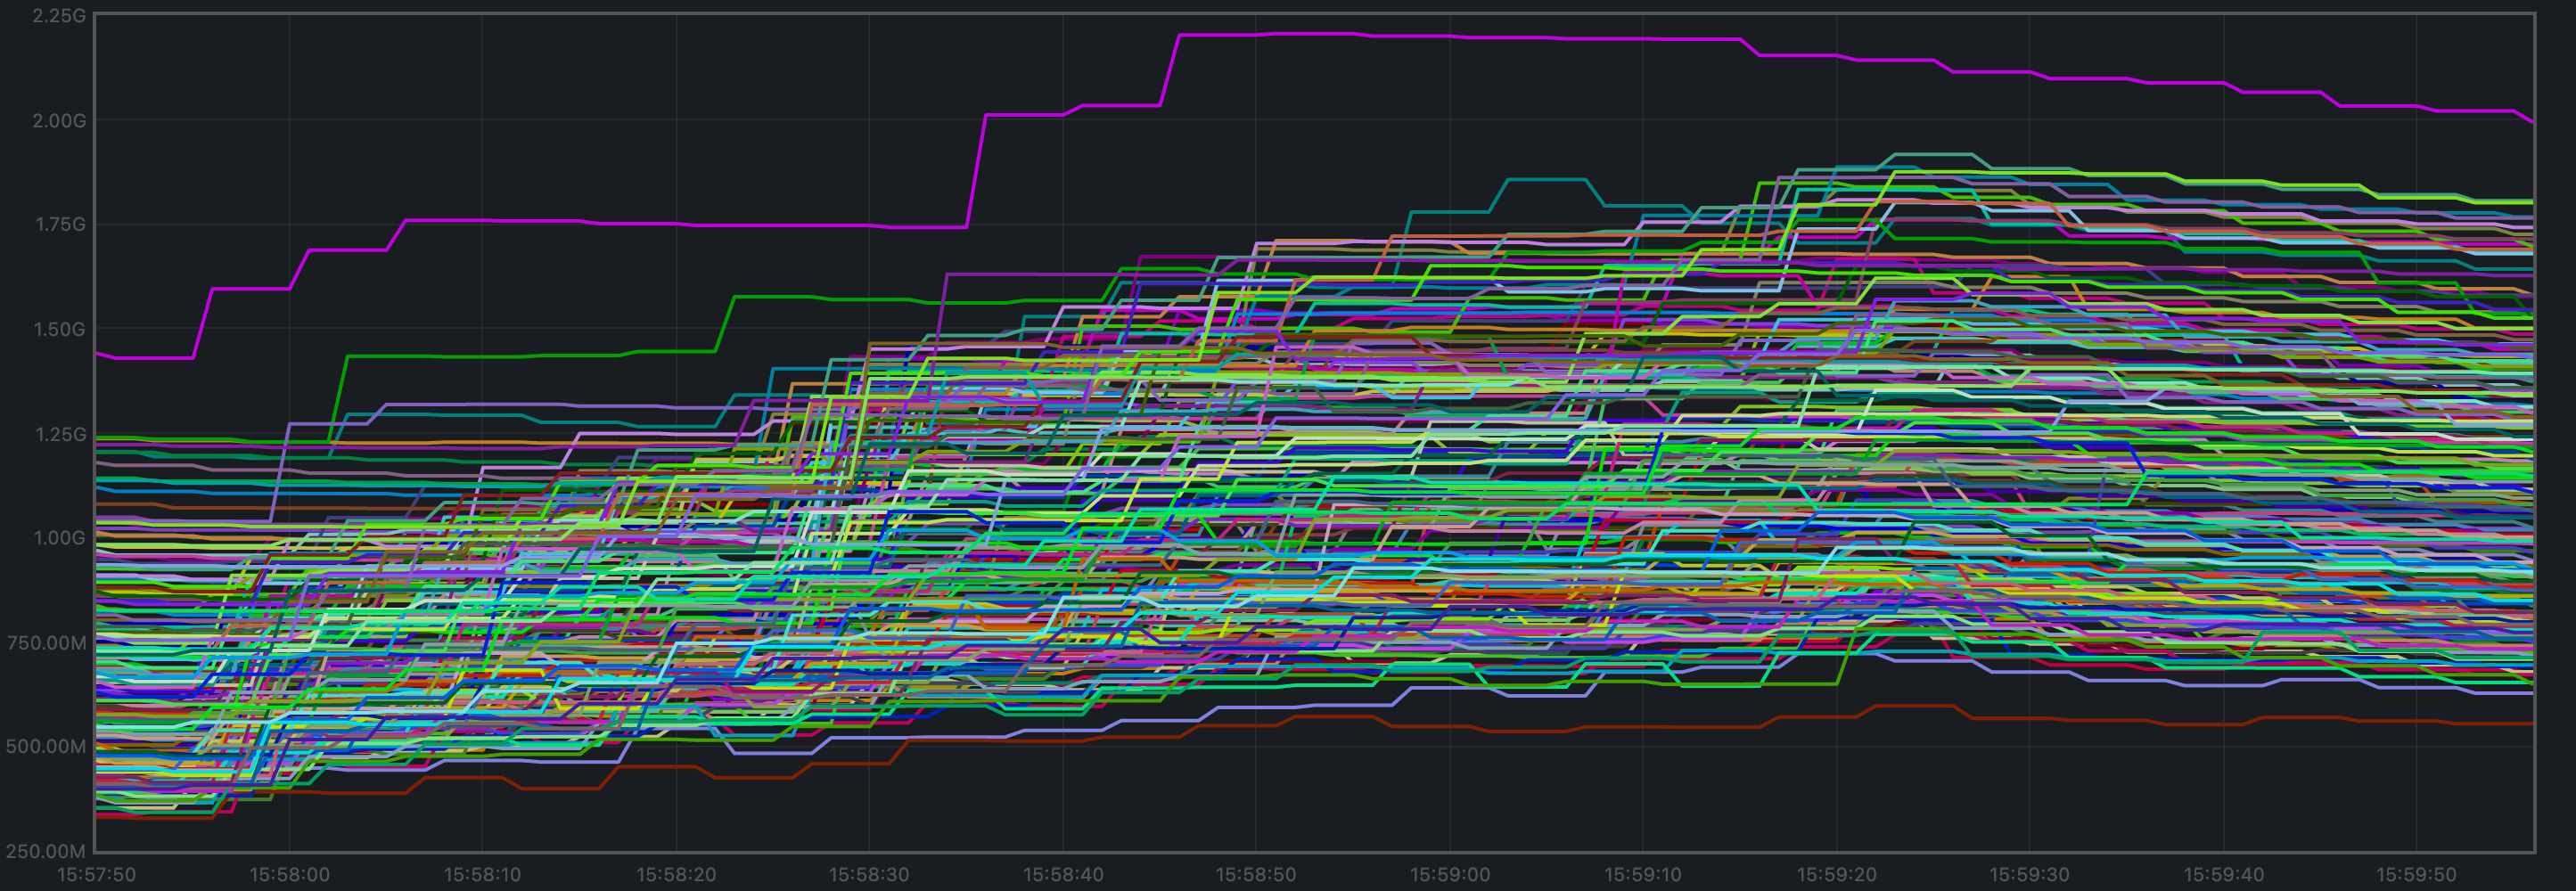 所有进程的平均值在 380 MiB 左右波动,没有表现出无约束增长。
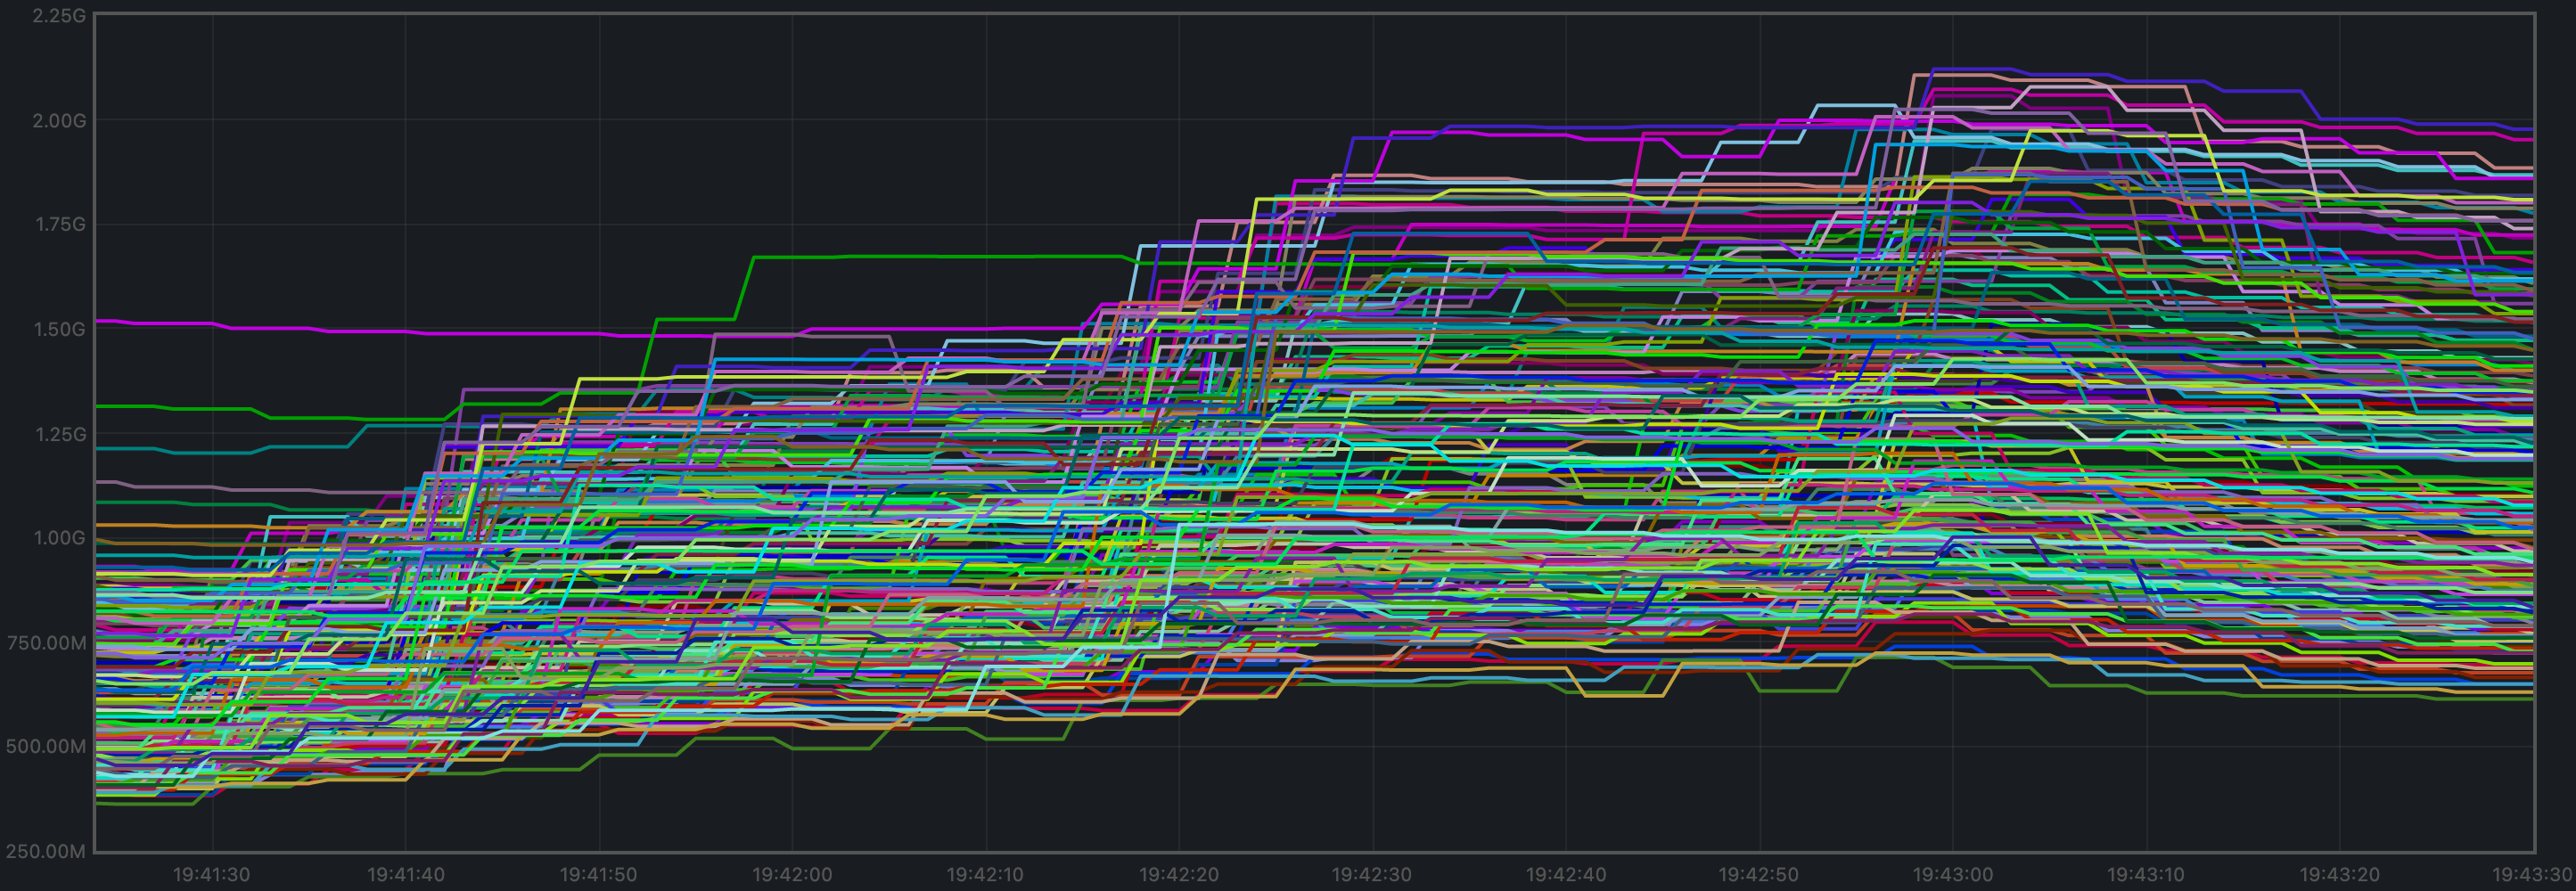
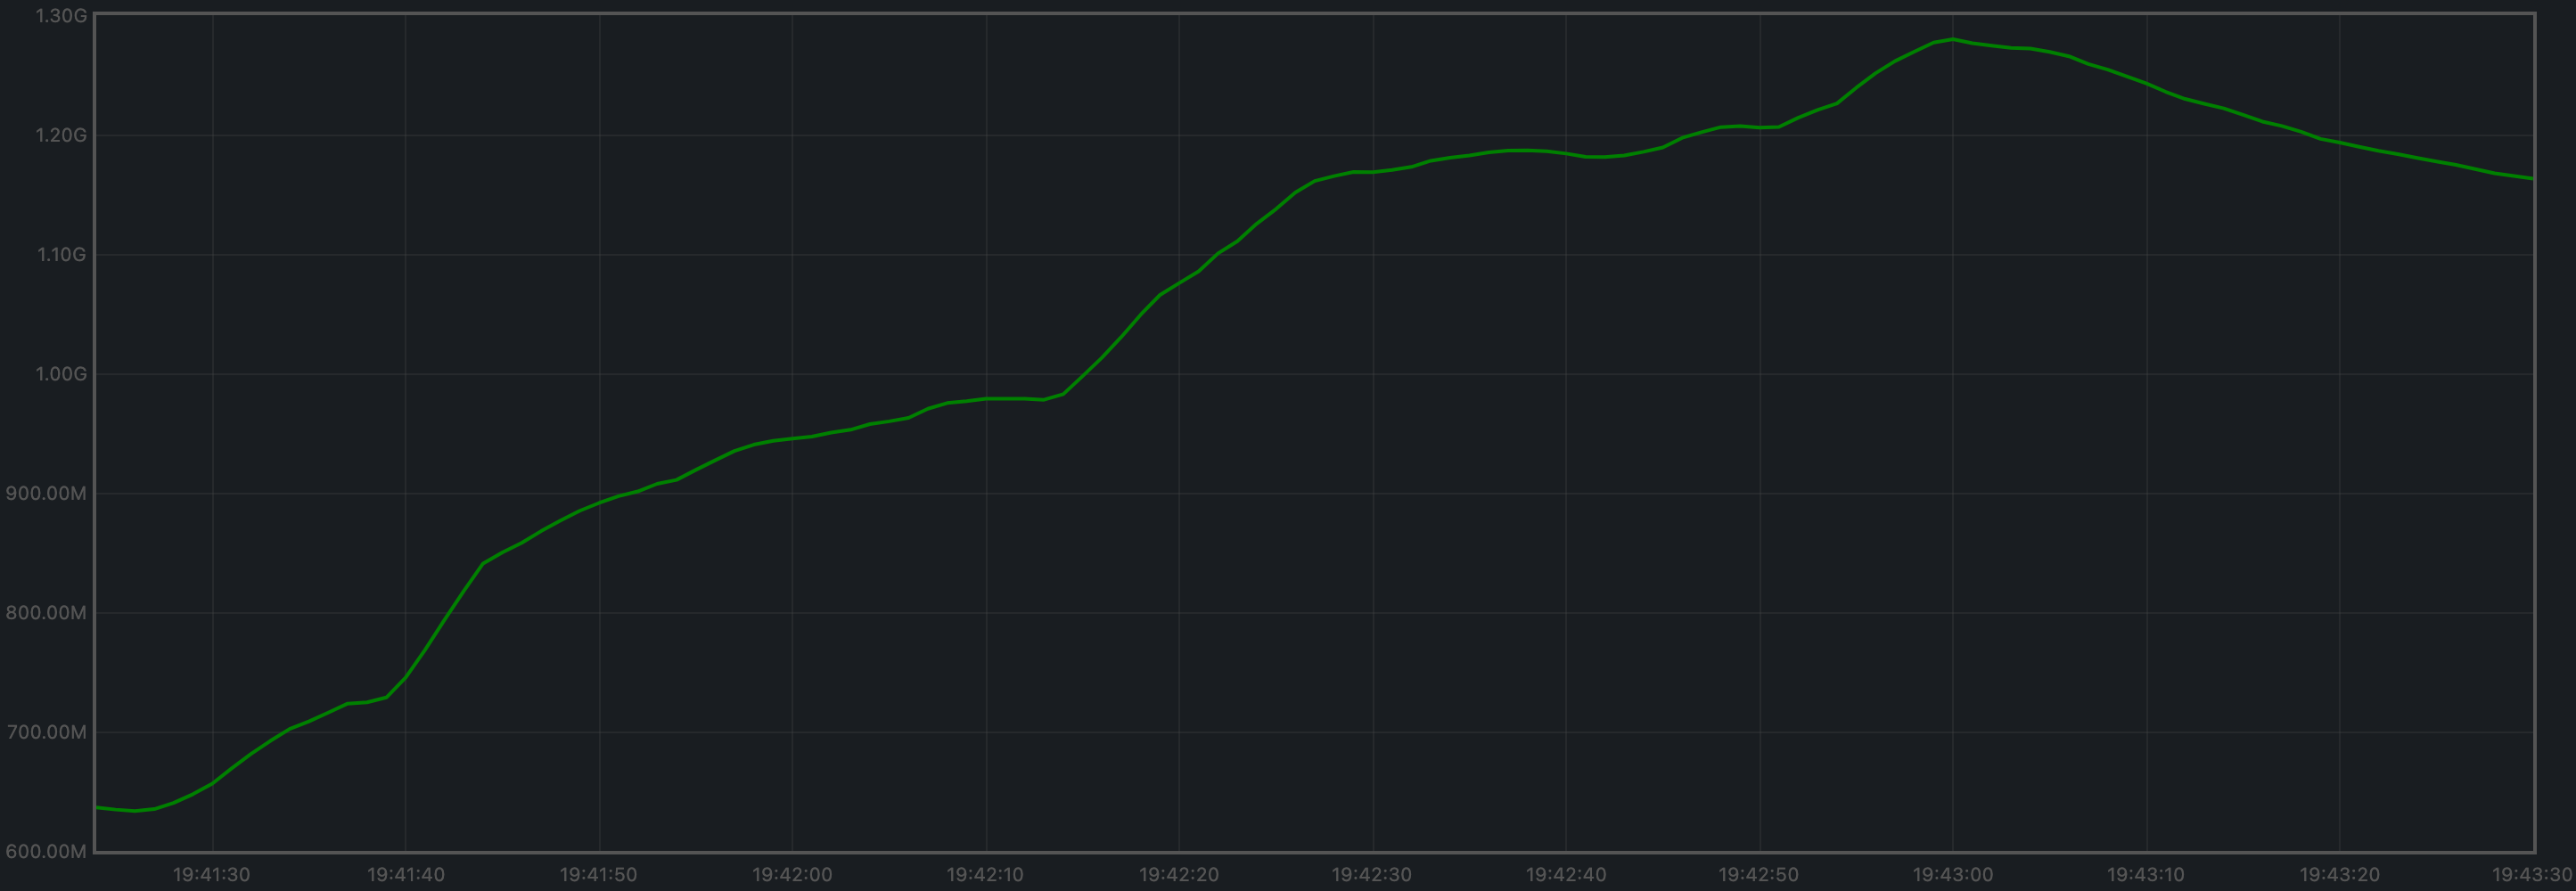
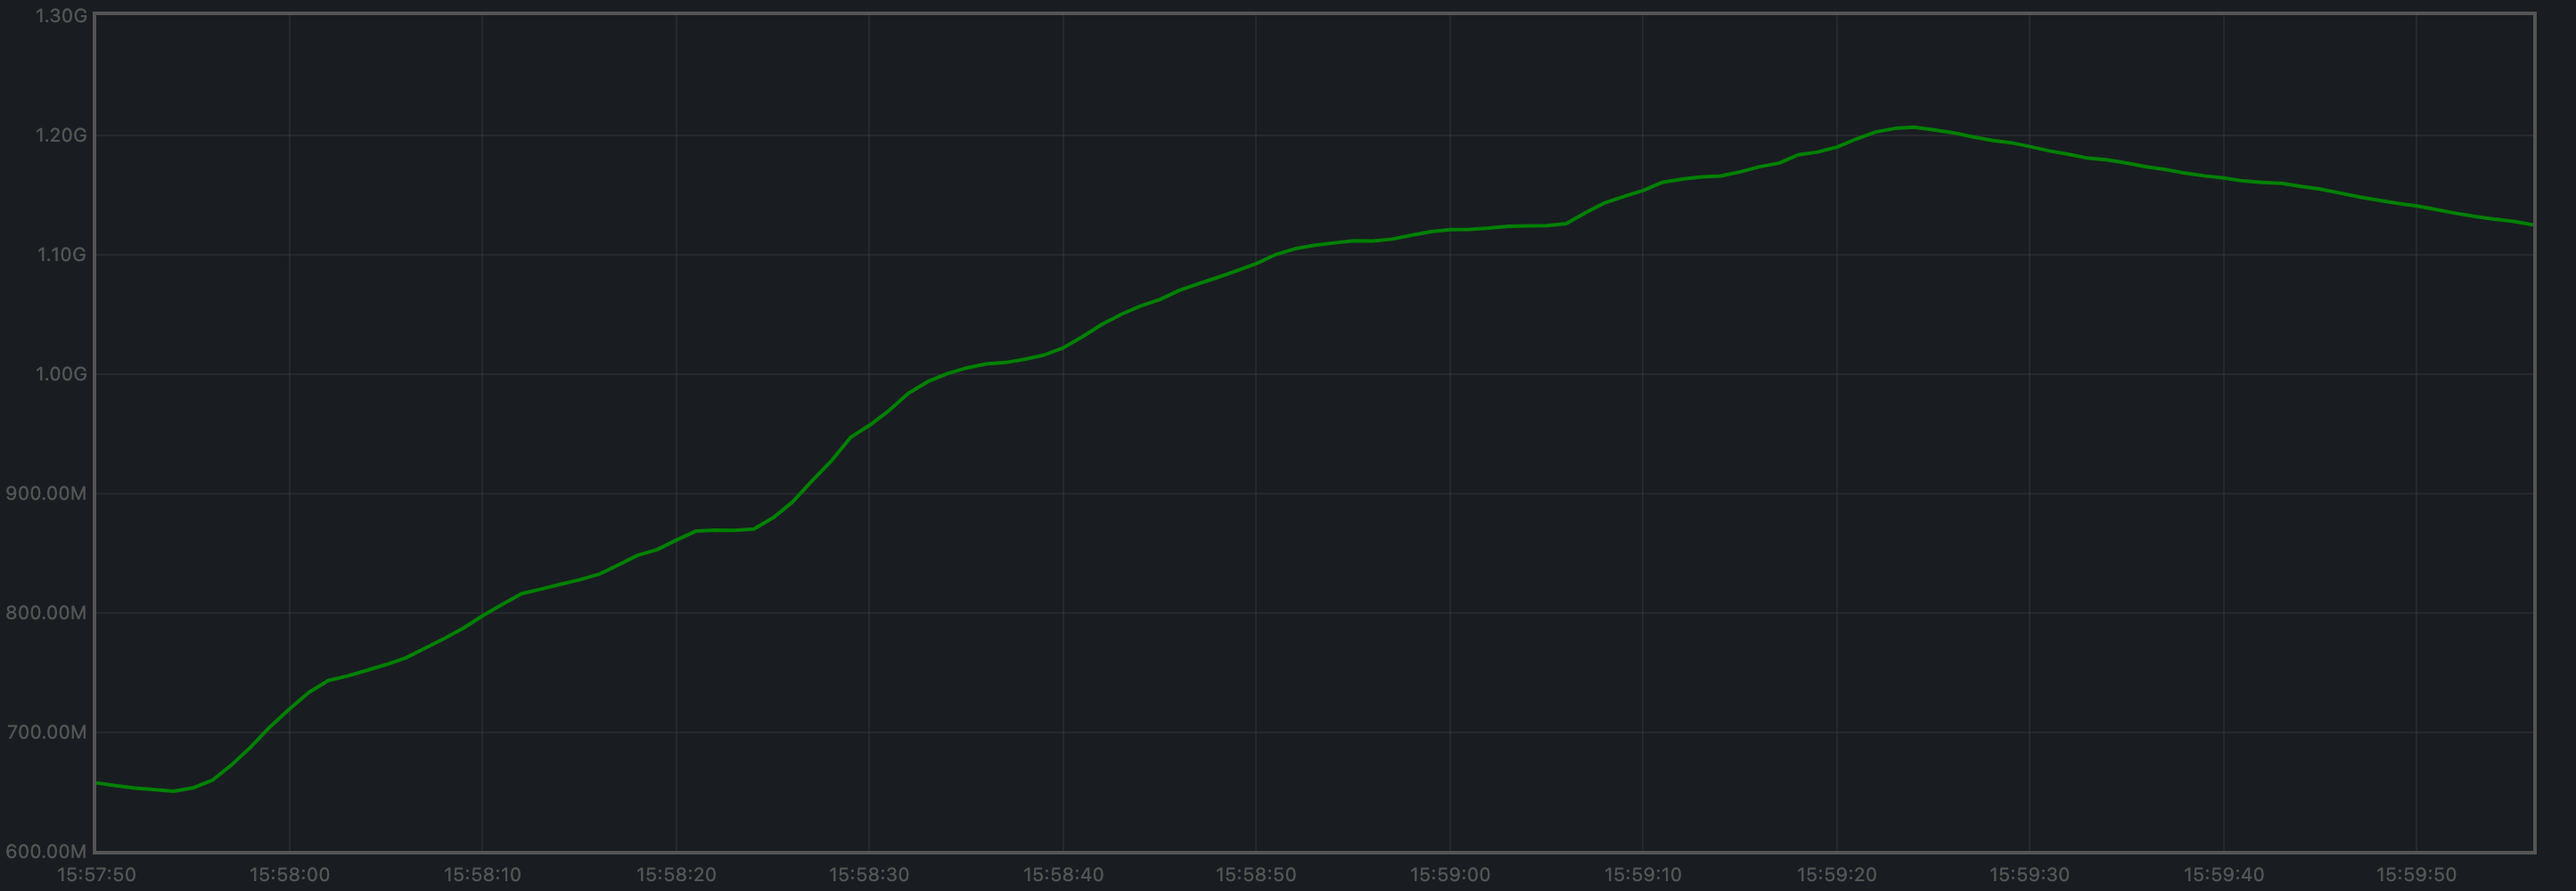 这些图与基线结果相似:
CPU 利用率
在 Unix 机器上,Prometheus 中衡量 CPU 利用率的最佳指标是load1,
因为它通常会出现在
top 的输出中。
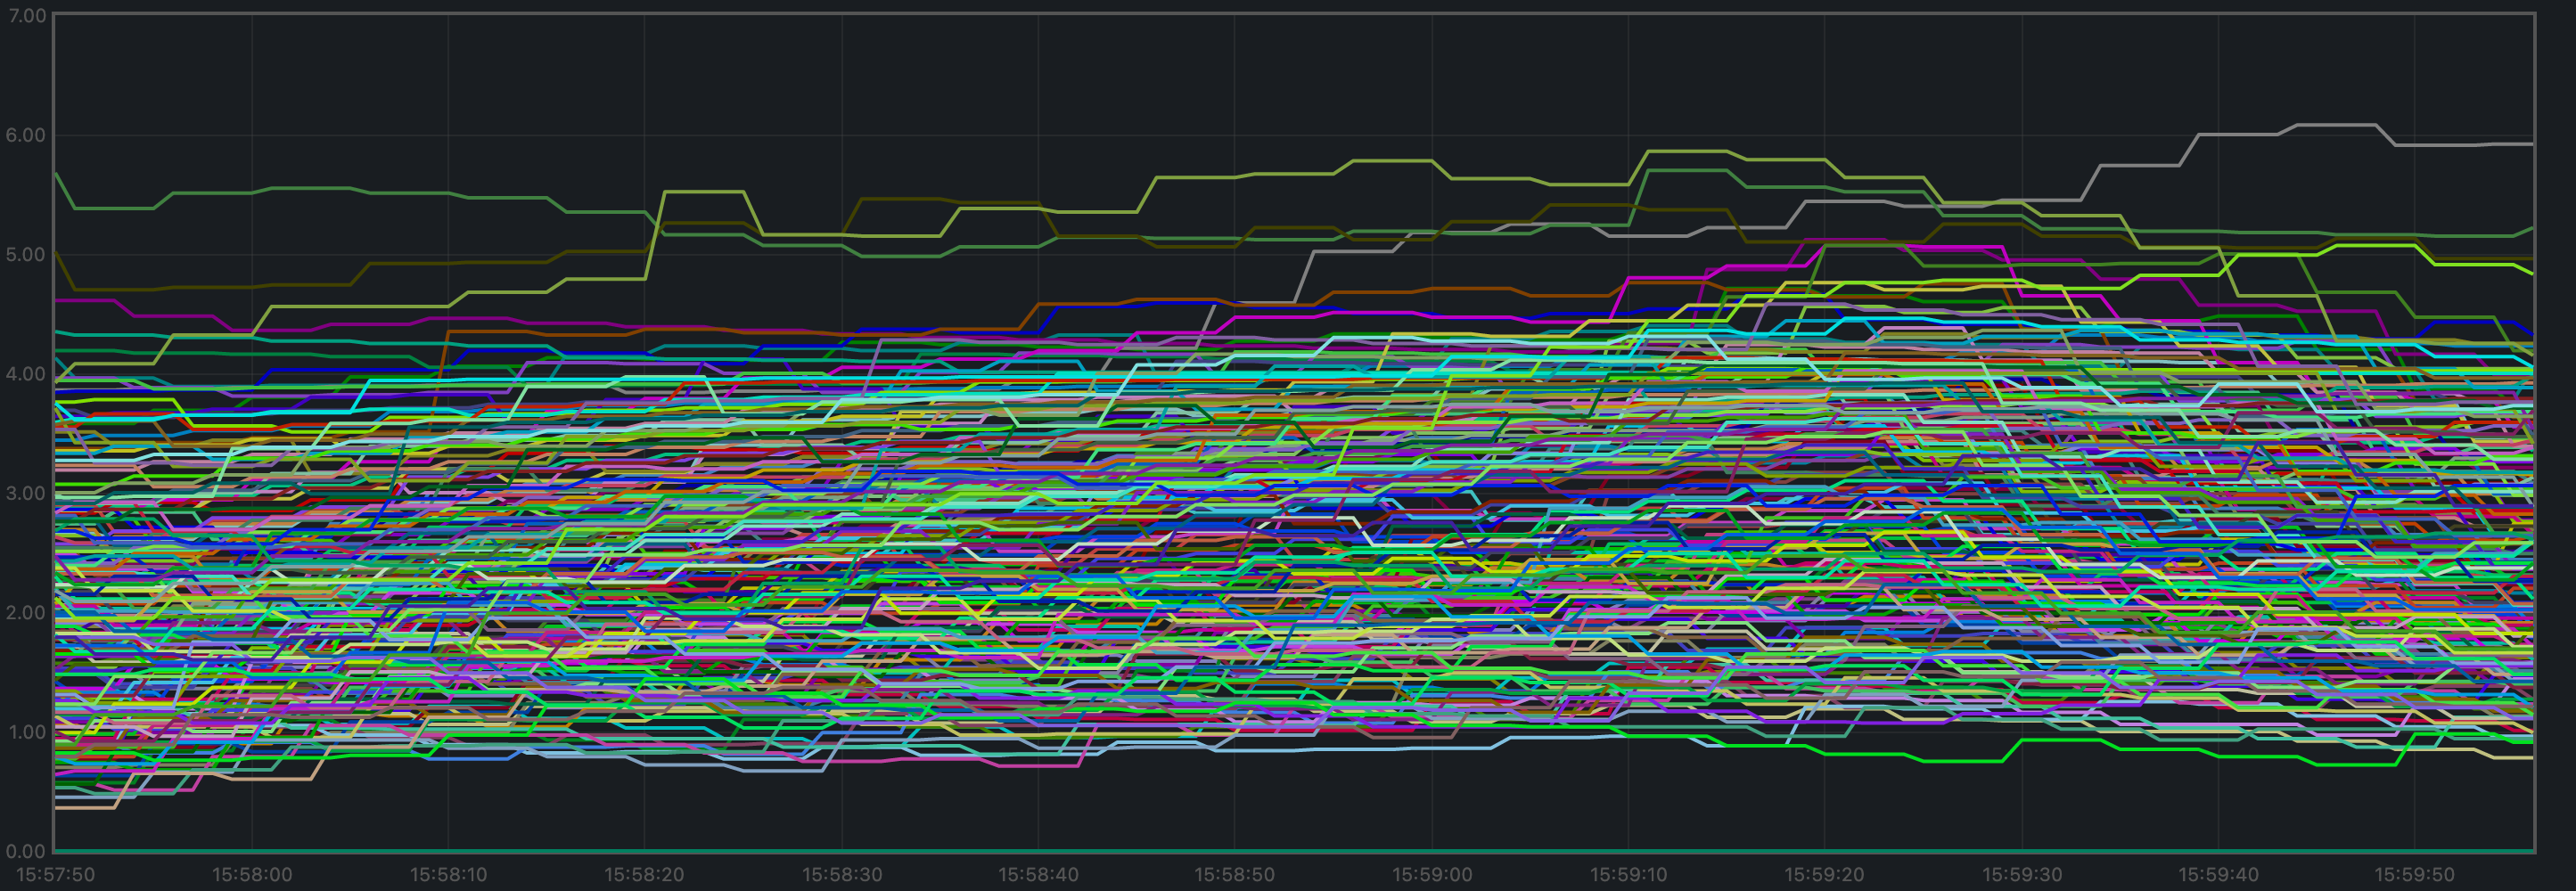 在大多数节点上,它都保持在 5 以下。
该图与基线结果相似:
在大多数节点上,它都保持在 5 以下。
该图与基线结果相似:
测试结果
结果:通过 日期:2022-10-14 版本:1cf9d8e276afe8595cba960b51cd056514965fd1轮换节点测试网
我们使用与基线相同的负载:c=4,r=800。
与基线测试一样,用于这些测试的 CometBFT 版本受到 #9539 的影响。
更多细节请参见基线报告中的这一段。
最后,请注意,这种设置可以更公平地比较该版本与基线。
延迟
所有延迟的图见此处。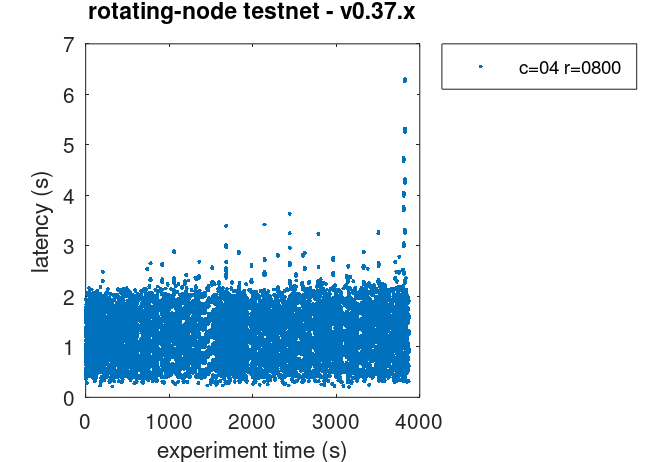 这与基线相似。
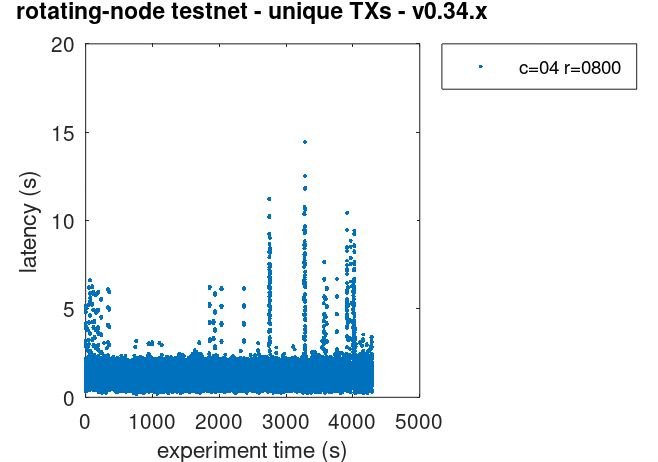 请注意,这里比较的是基线中使用_唯一_
交易的图。这是因为在基线实验期间检测到的重复交易问题
并未在
请注意,这里比较的是基线中使用_唯一_
交易的图。这是因为在基线实验期间检测到的重复交易问题
并未在 v0.37 中出现,但这_并不能证明_该问题在 v0.37 中不存在。
Prometheus 指标
此处展示的指标集与基线(v0.34)同一实验中展示的指标一致。
同时也给出基线结果以供比较。
每分钟区块数与交易数
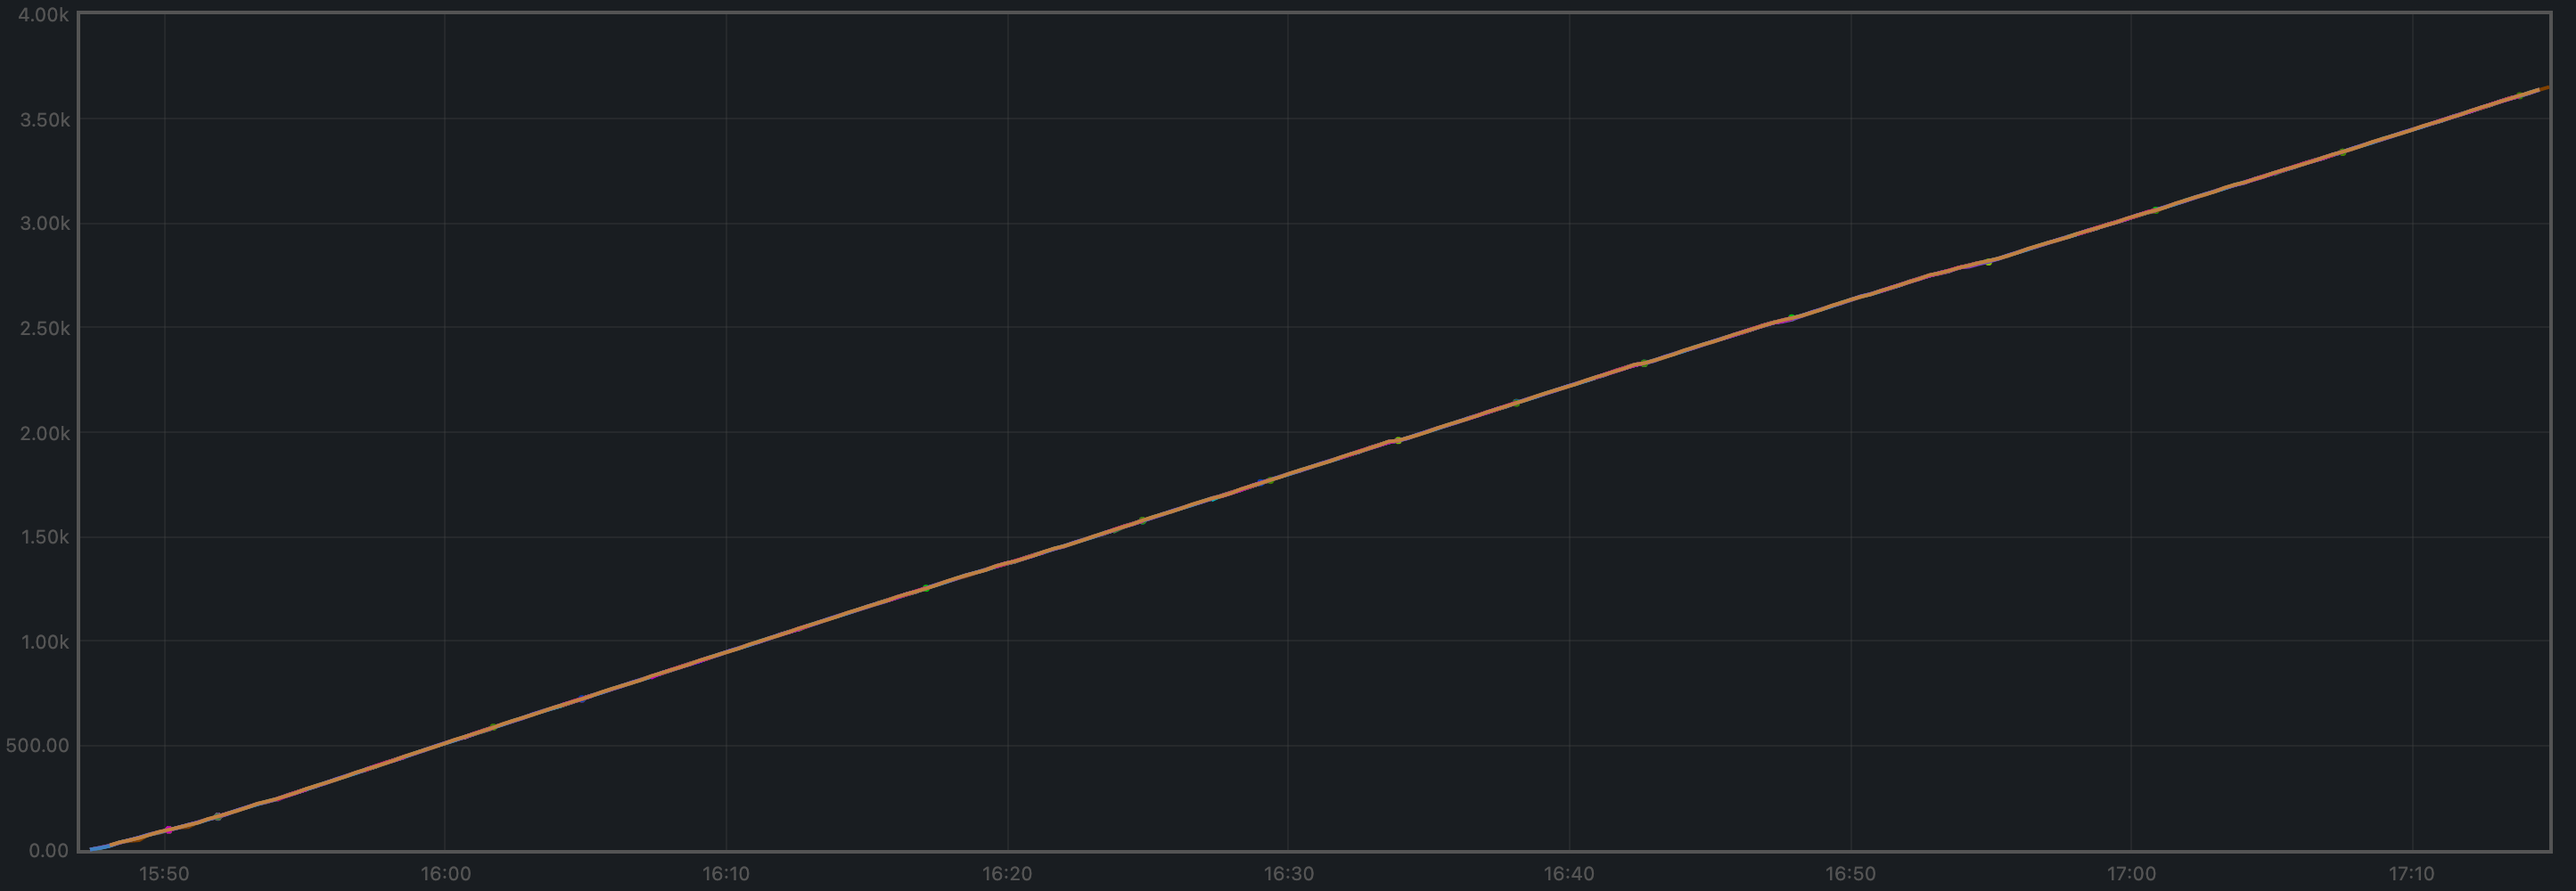
每分钟产生的区块数就是下图的斜率。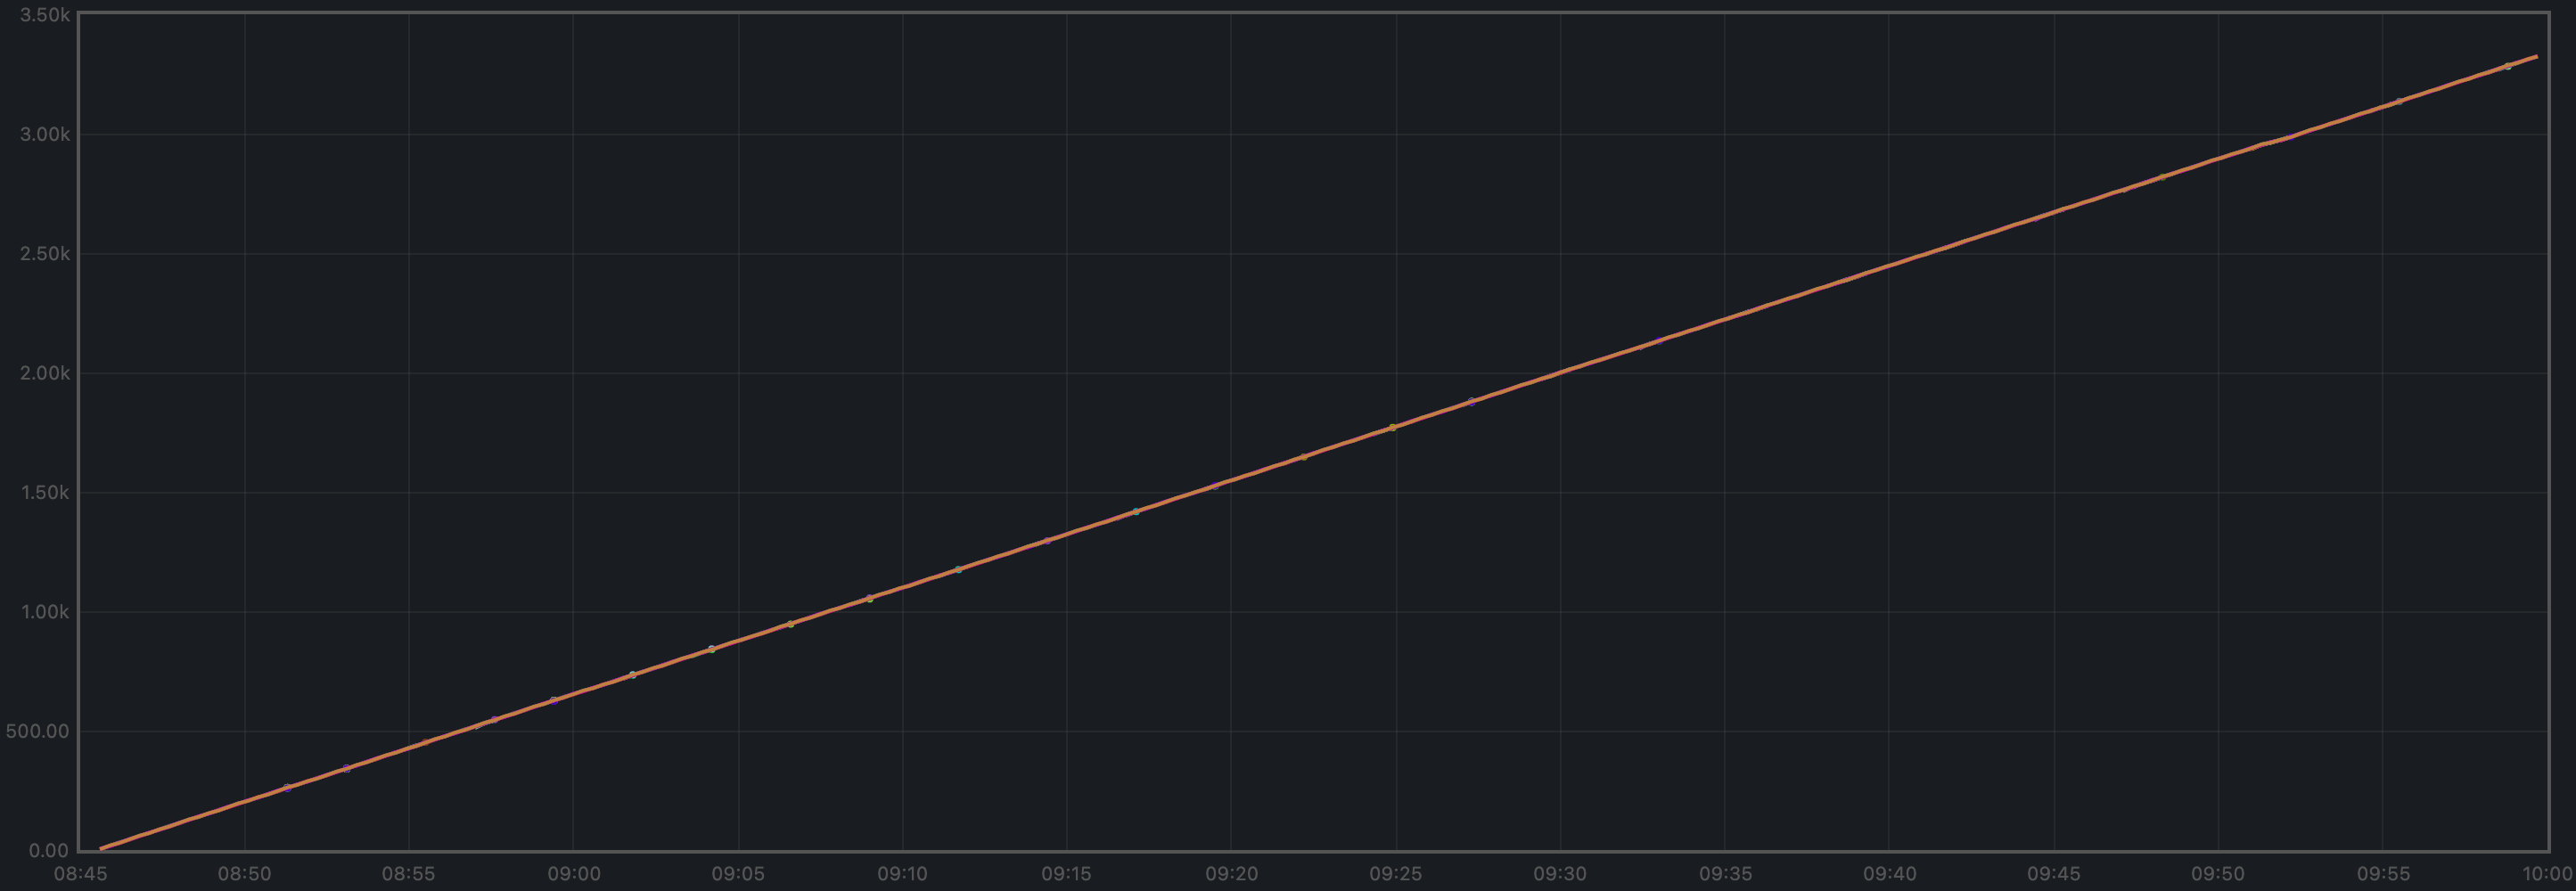 在 4446 秒时间内,高度从 5 增长到 3323。
由此可得平均每分钟产生 45 个区块,
与下方展示的基线结果相似。
在 4446 秒时间内,高度从 5 增长到 3323。
由此可得平均每分钟产生 45 个区块,
与下方展示的基线结果相似。
 下面两张图仅显示临时节点上报的高度。
第二张图是用于比较的基线图。
下面两张图仅显示临时节点上报的高度。
第二张图是用于比较的基线图。
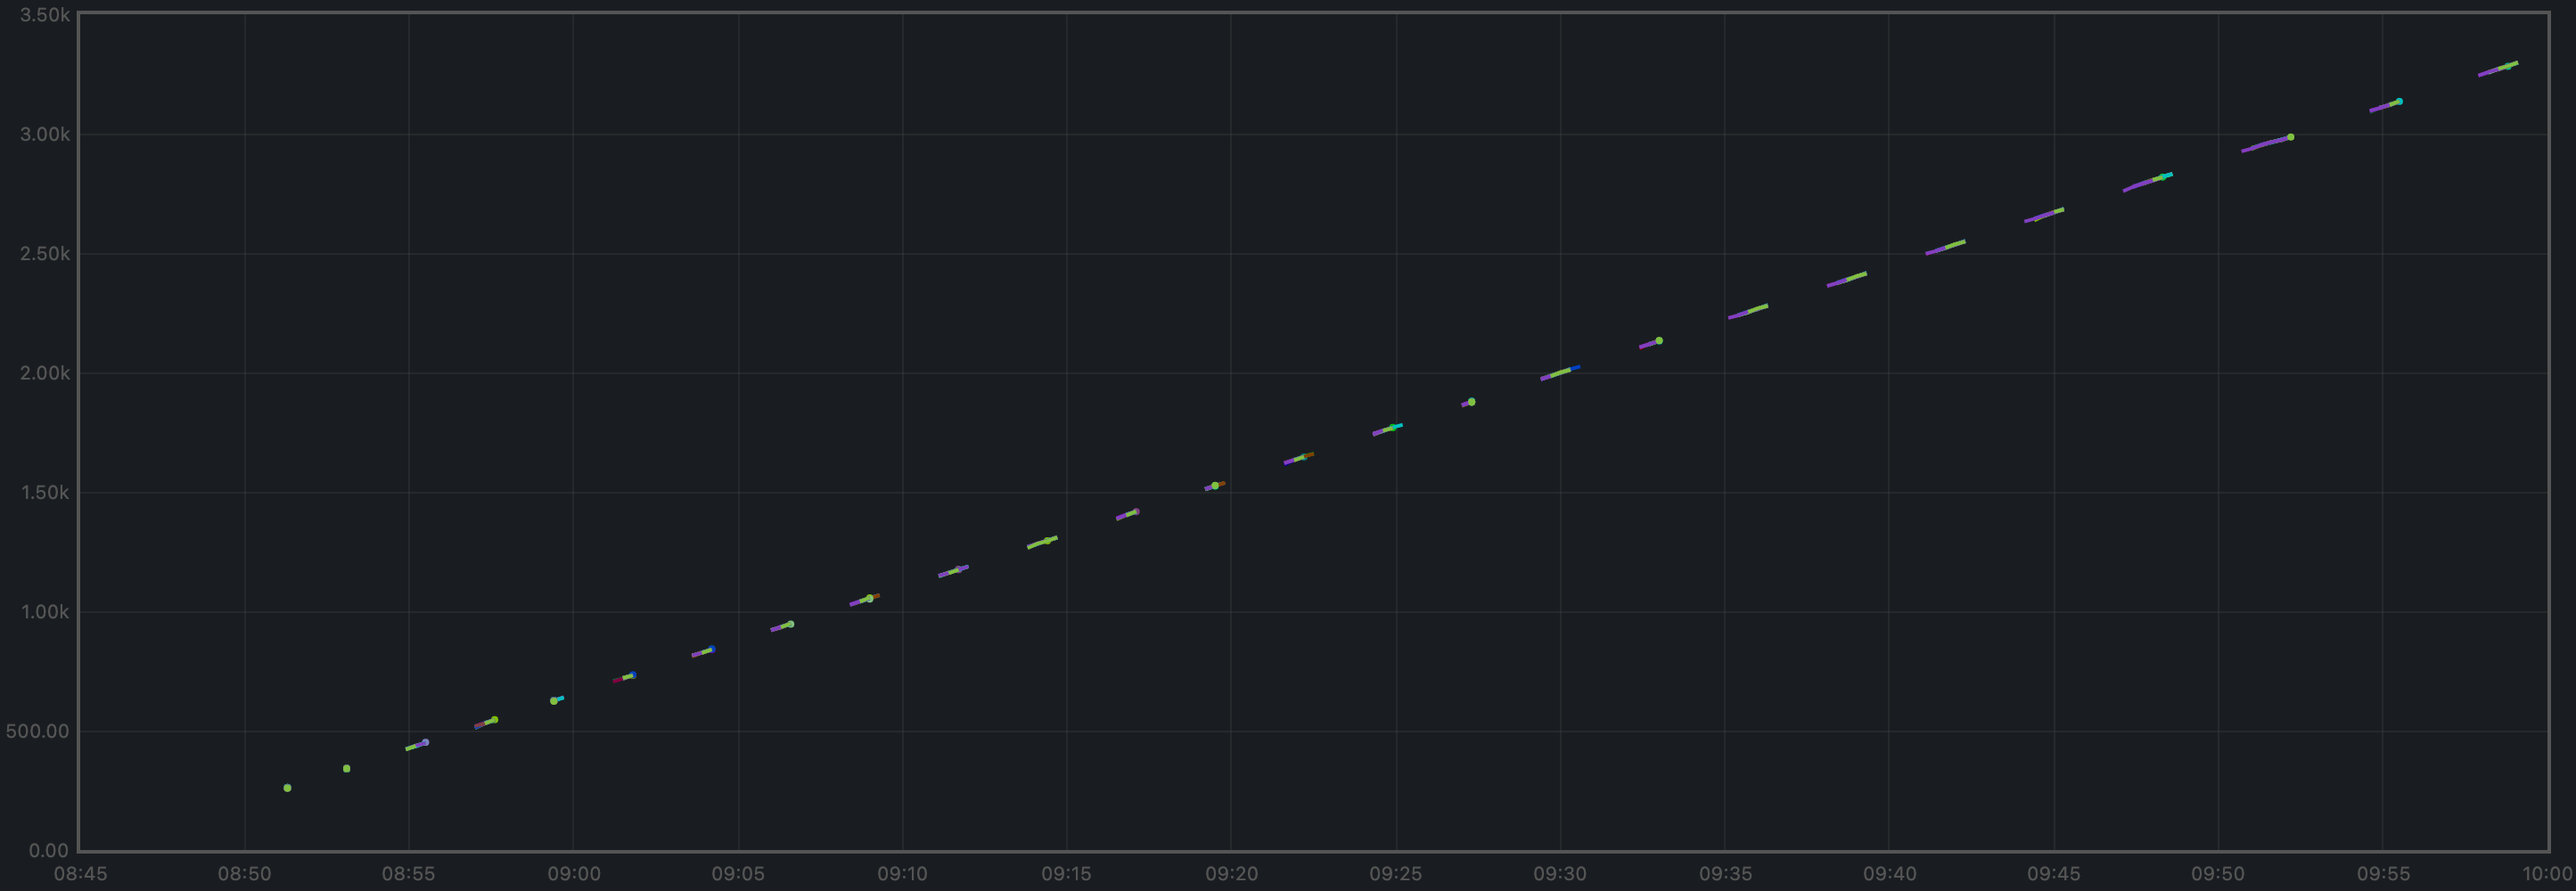
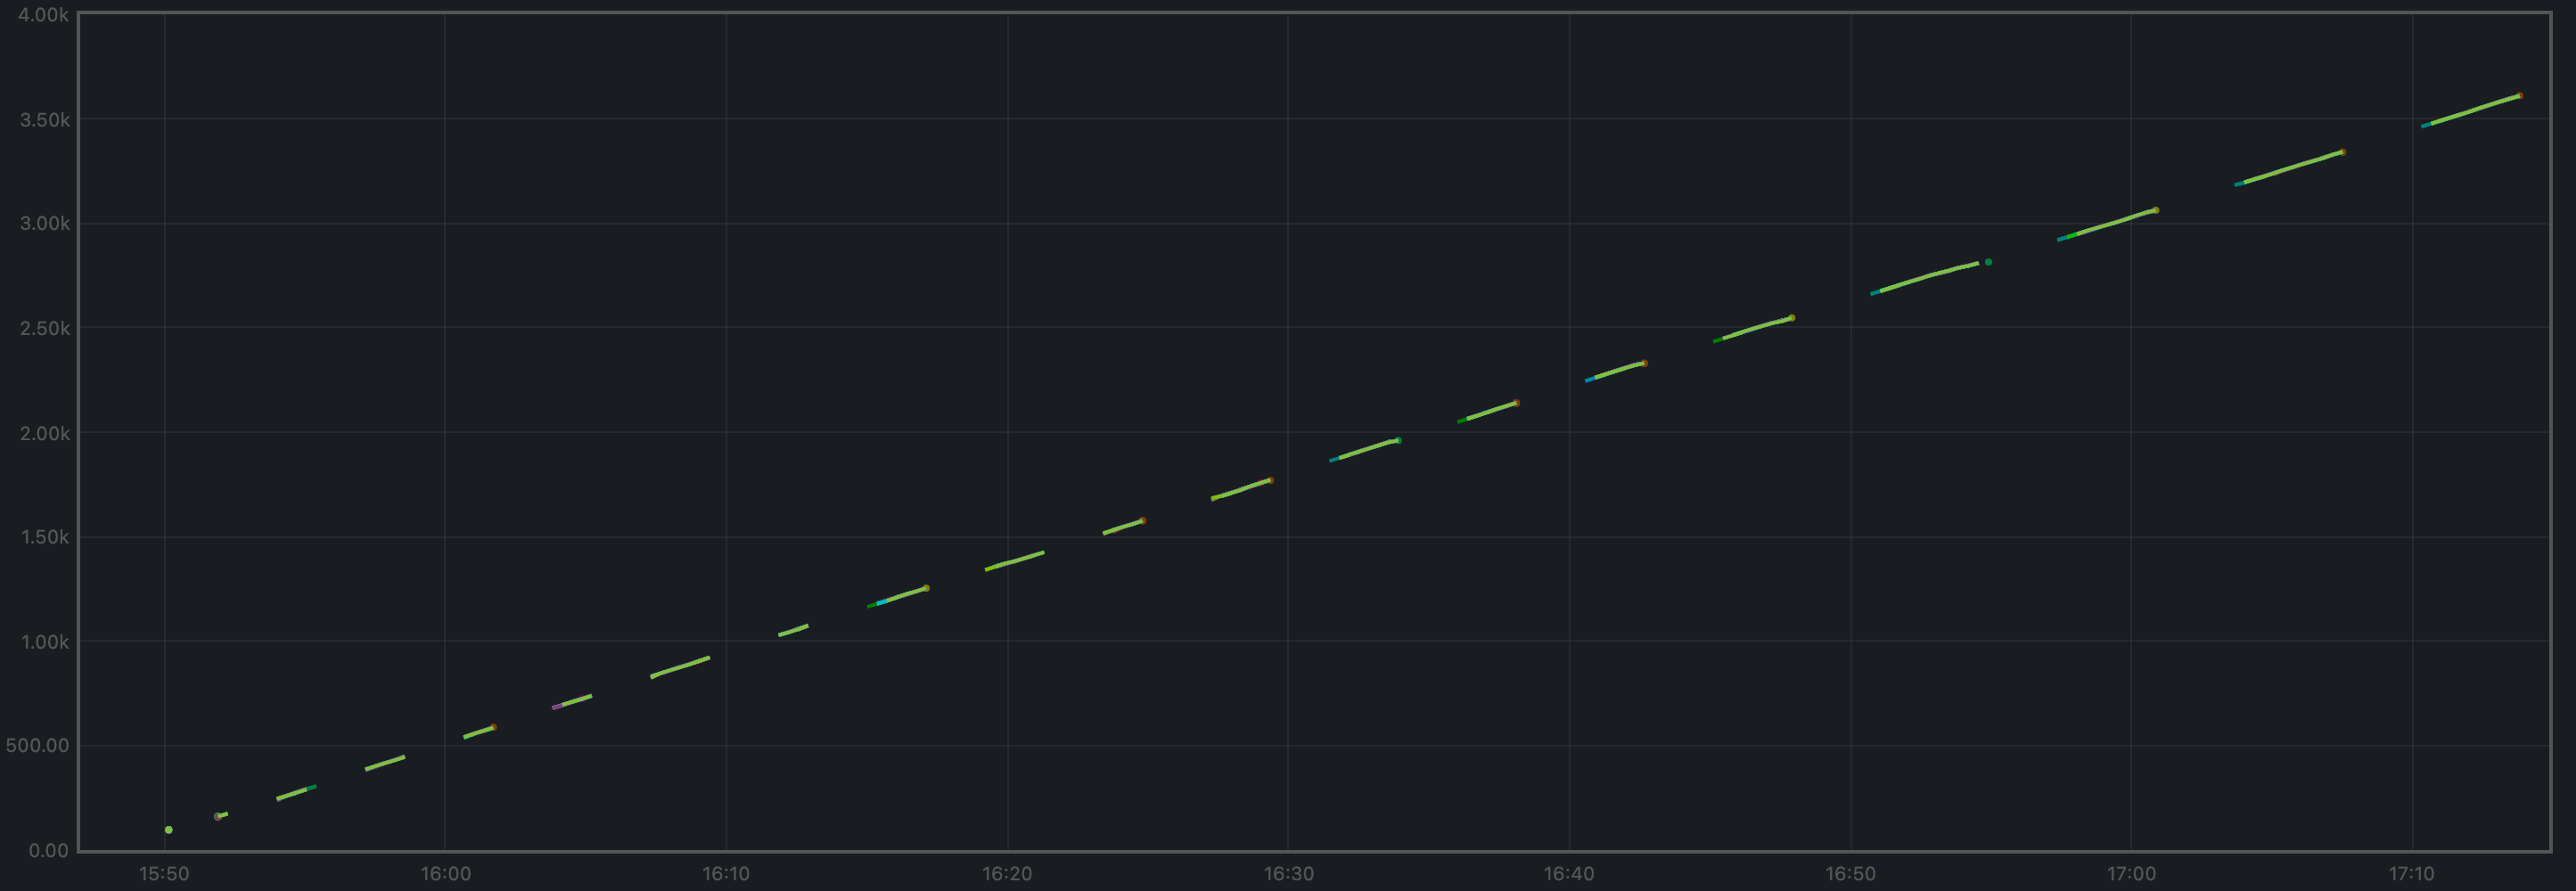 从线段长度可以看出,
v0.37 中的临时节点
追赶速度略快一些。
每分钟处理的交易数就是下图的斜率。
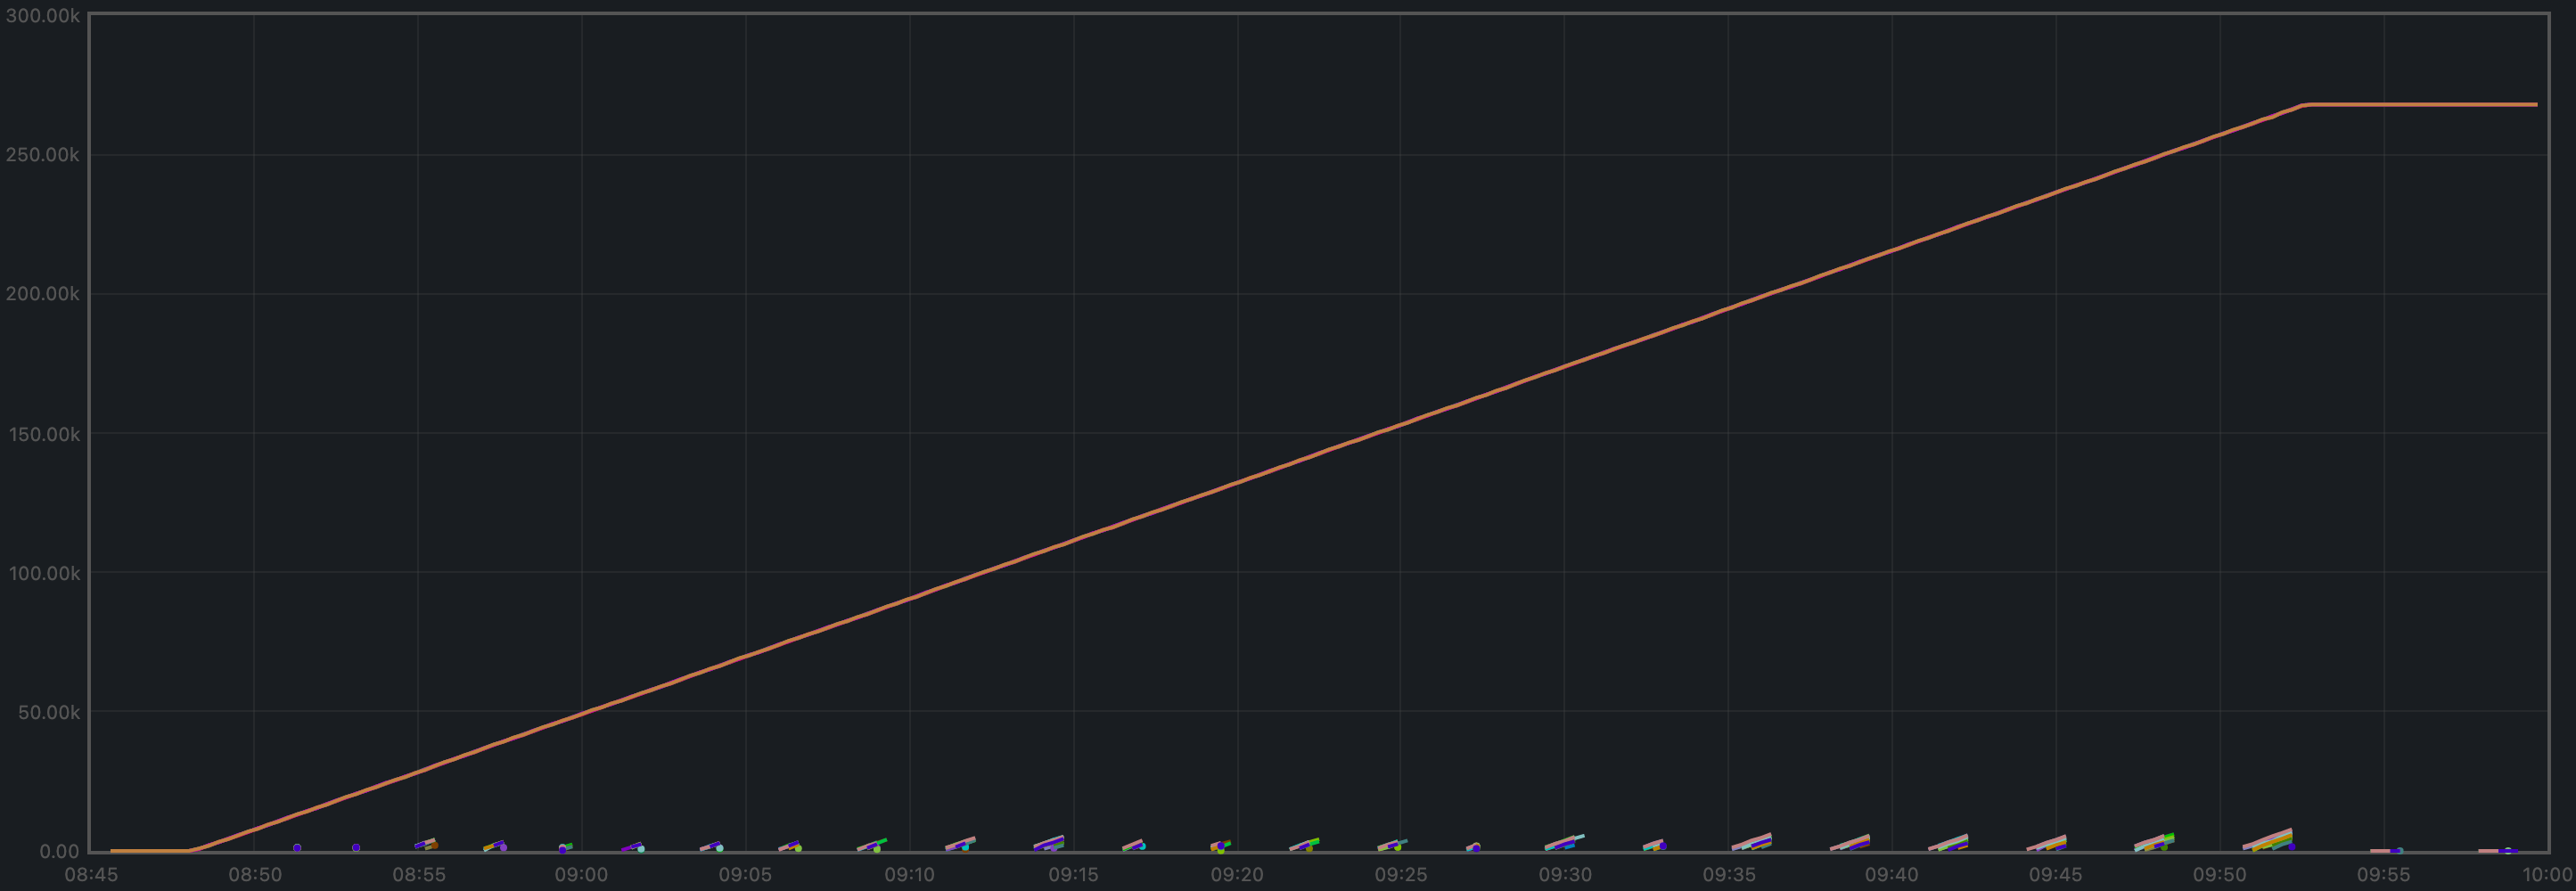 在 3852 秒时间内,其中一个验证者的交易总数从 597 增长到 267298,
得到每分钟 4154 笔交易,略低于基线,
尽管基线还需要处理重复交易。
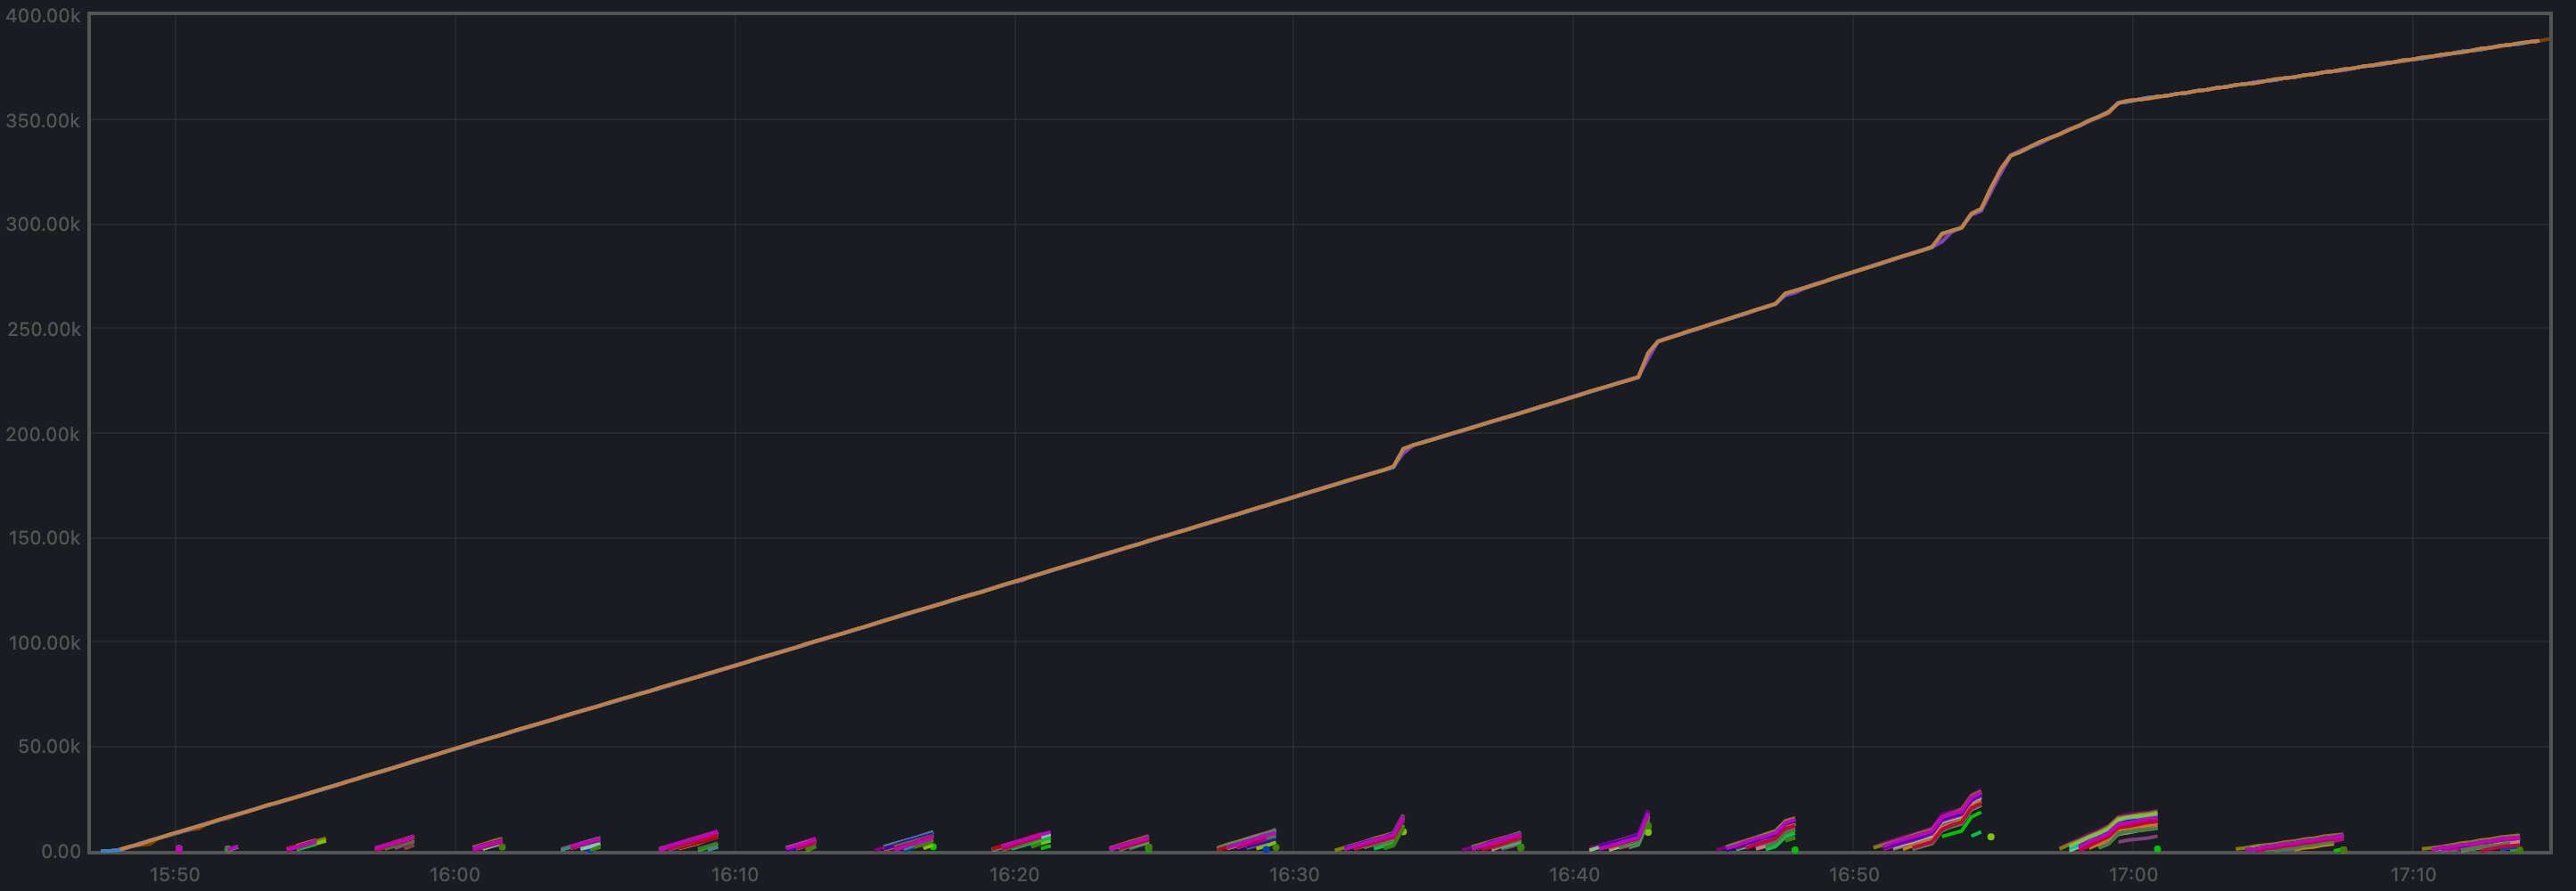
作为对比,下面是基线图。
在 3852 秒时间内,其中一个验证者的交易总数从 597 增长到 267298,
得到每分钟 4154 笔交易,略低于基线,
尽管基线还需要处理重复交易。
作为对比,下面是基线图。
对等节点
下图展示了整个实验过程中对等节点数量的变化。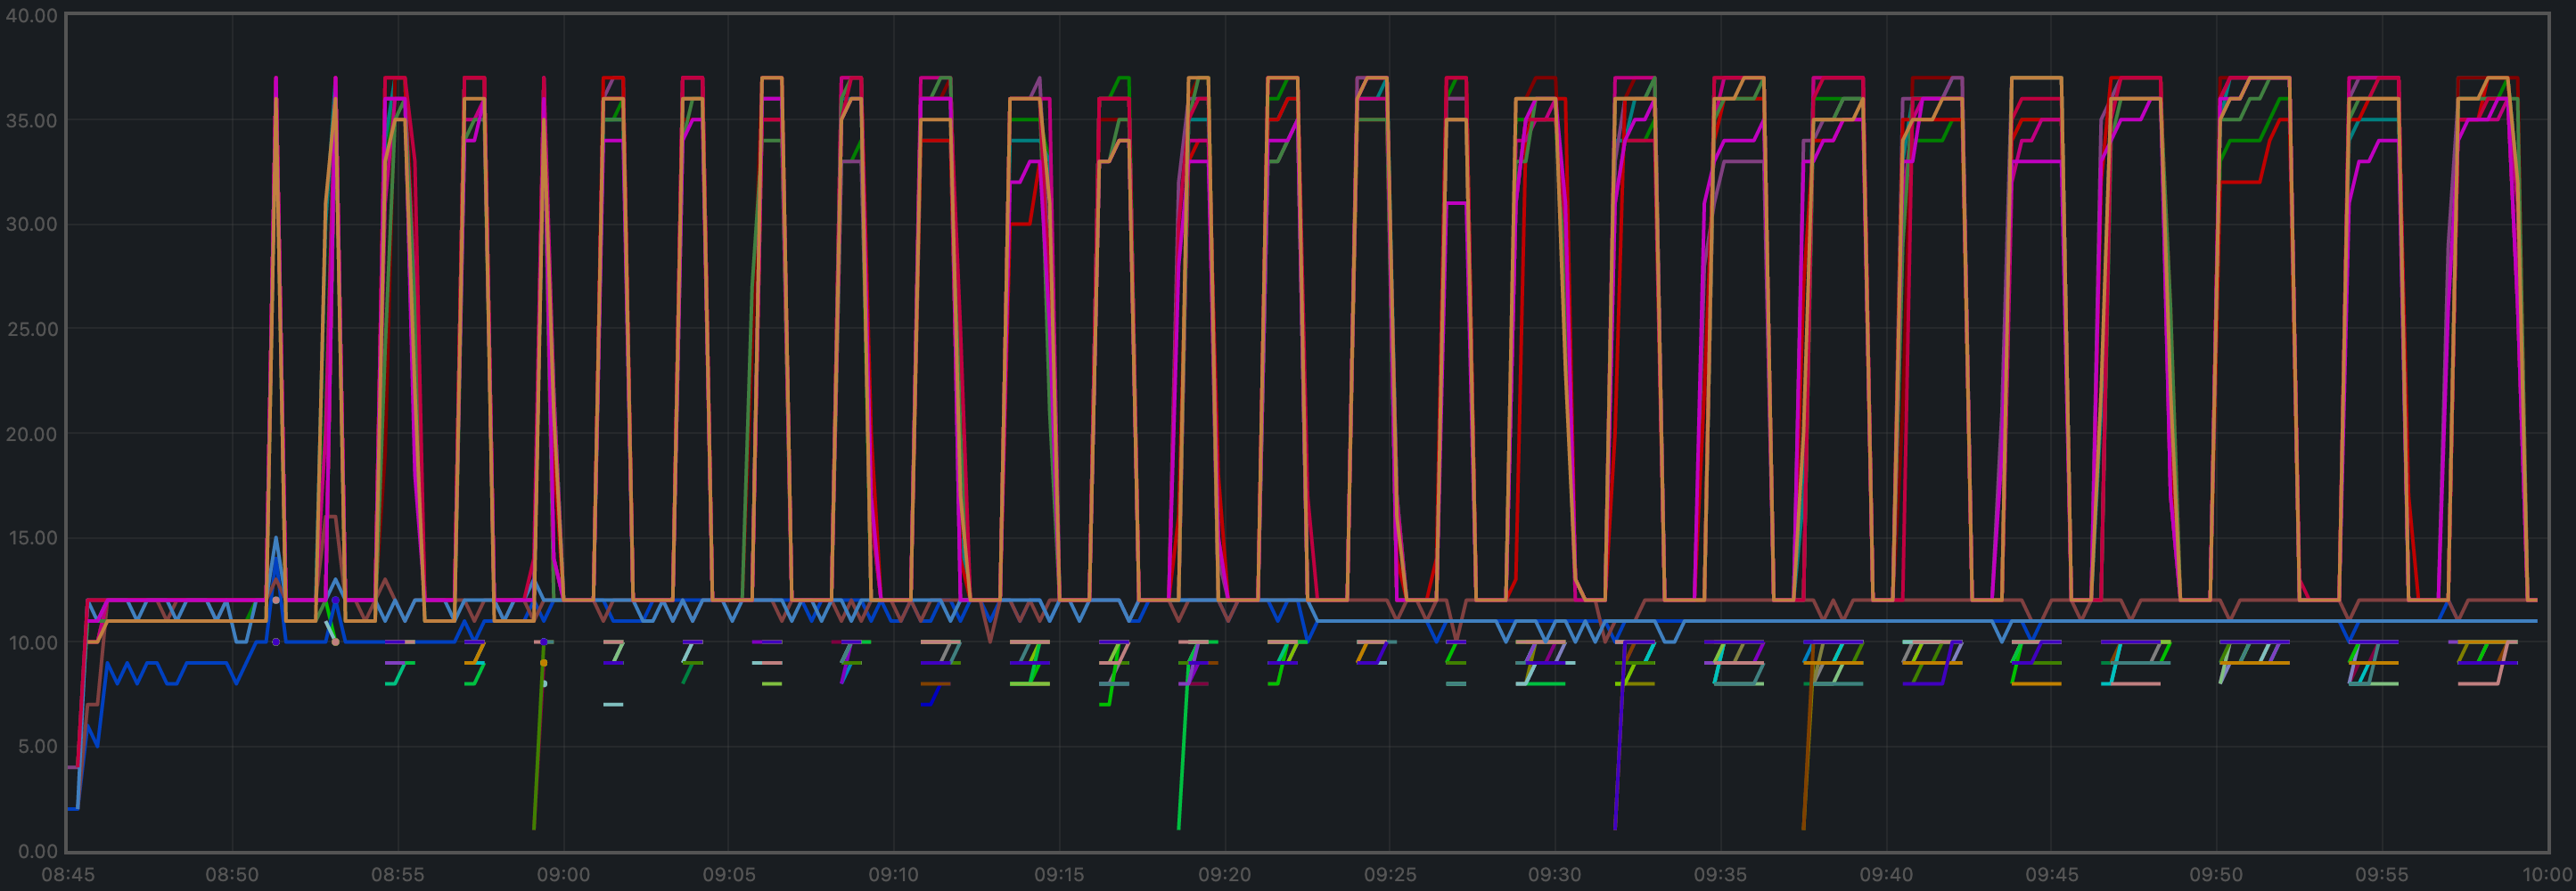 下面是用于比较的基线图。
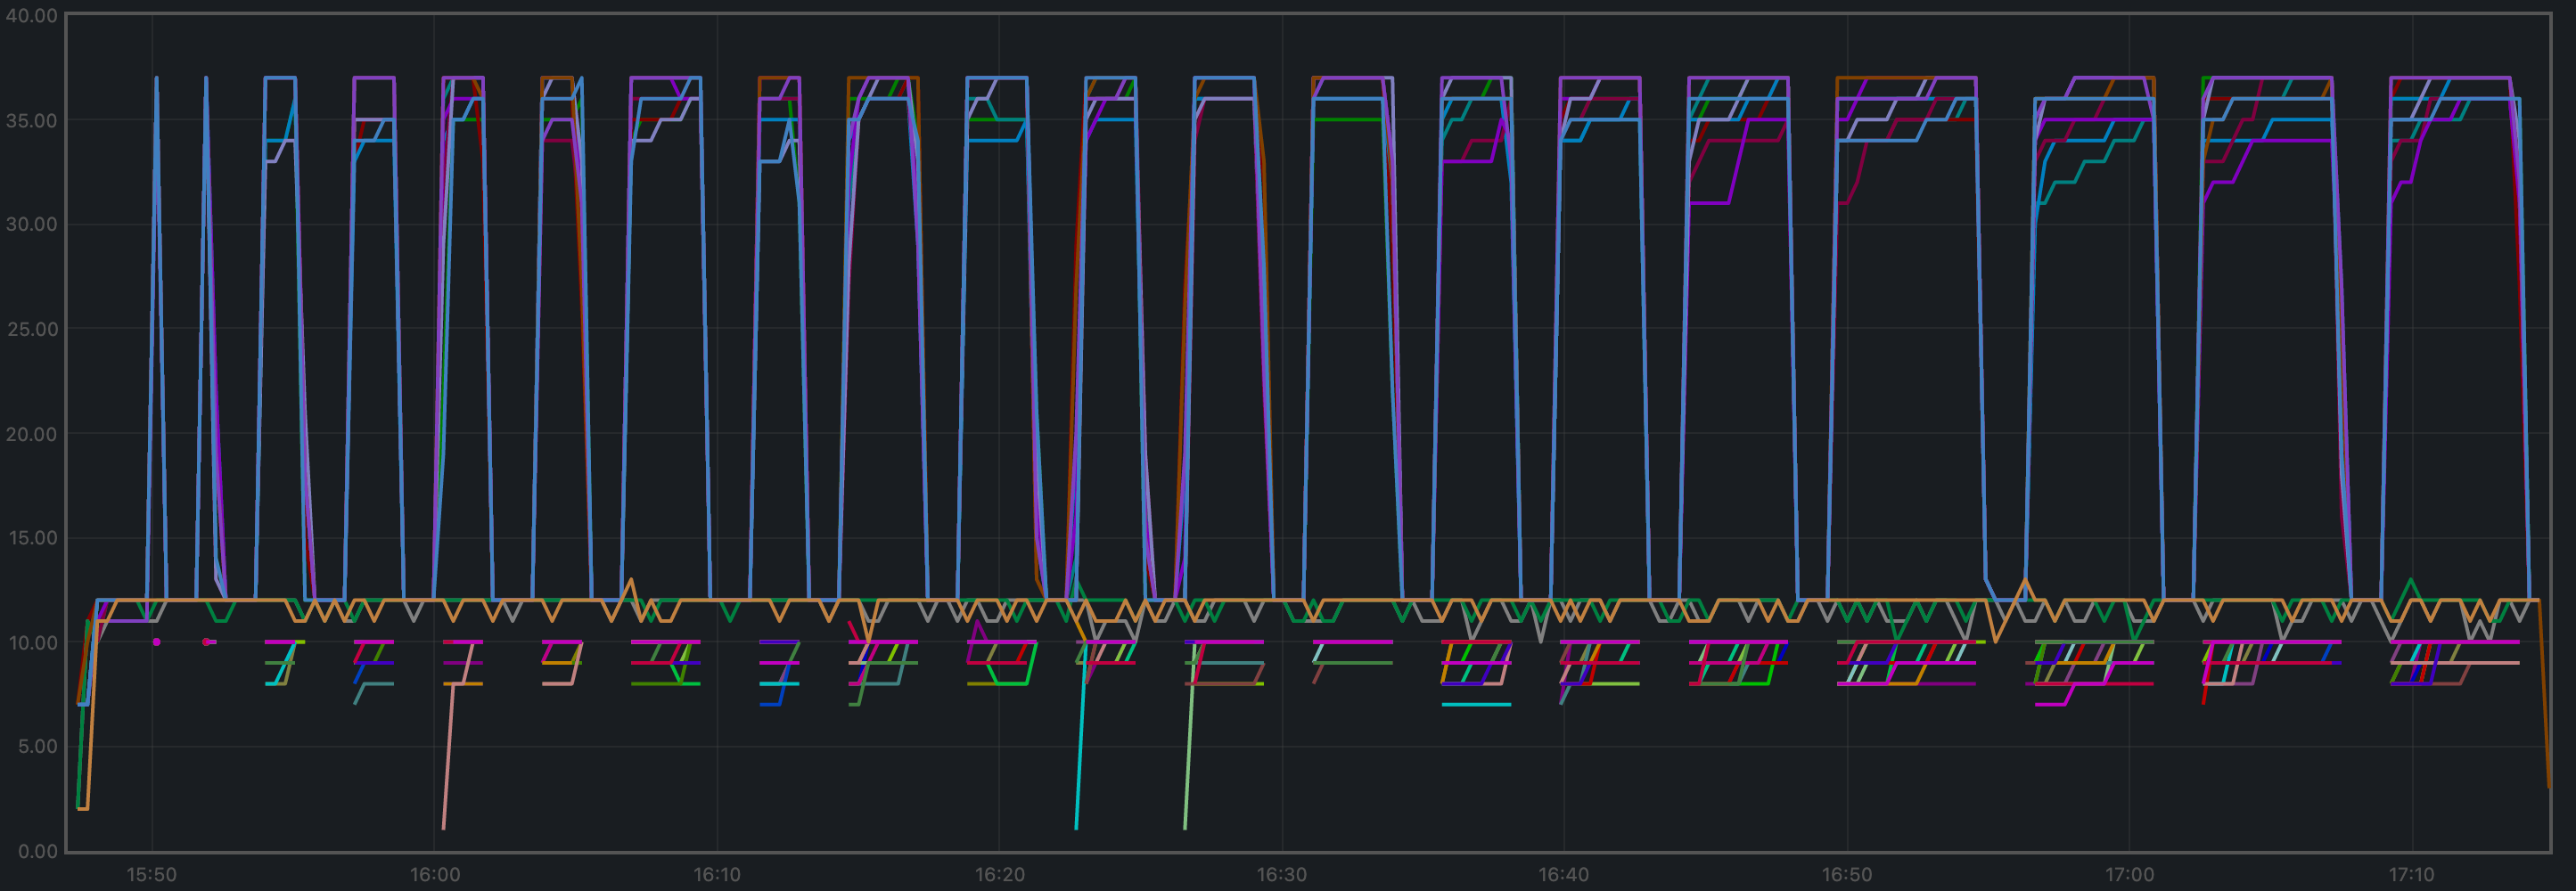 两张图中的数值及其变化趋势具有可比性。
关于这些图的更多细节,请参见基线报告。
两张图中的数值及其变化趋势具有可比性。
关于这些图的更多细节,请参见基线报告。
常驻集大小
所有进程的平均常驻集大小(RSS)在v0.37 上(第一张图)
看起来比基线(第二张图)略微更稳定。
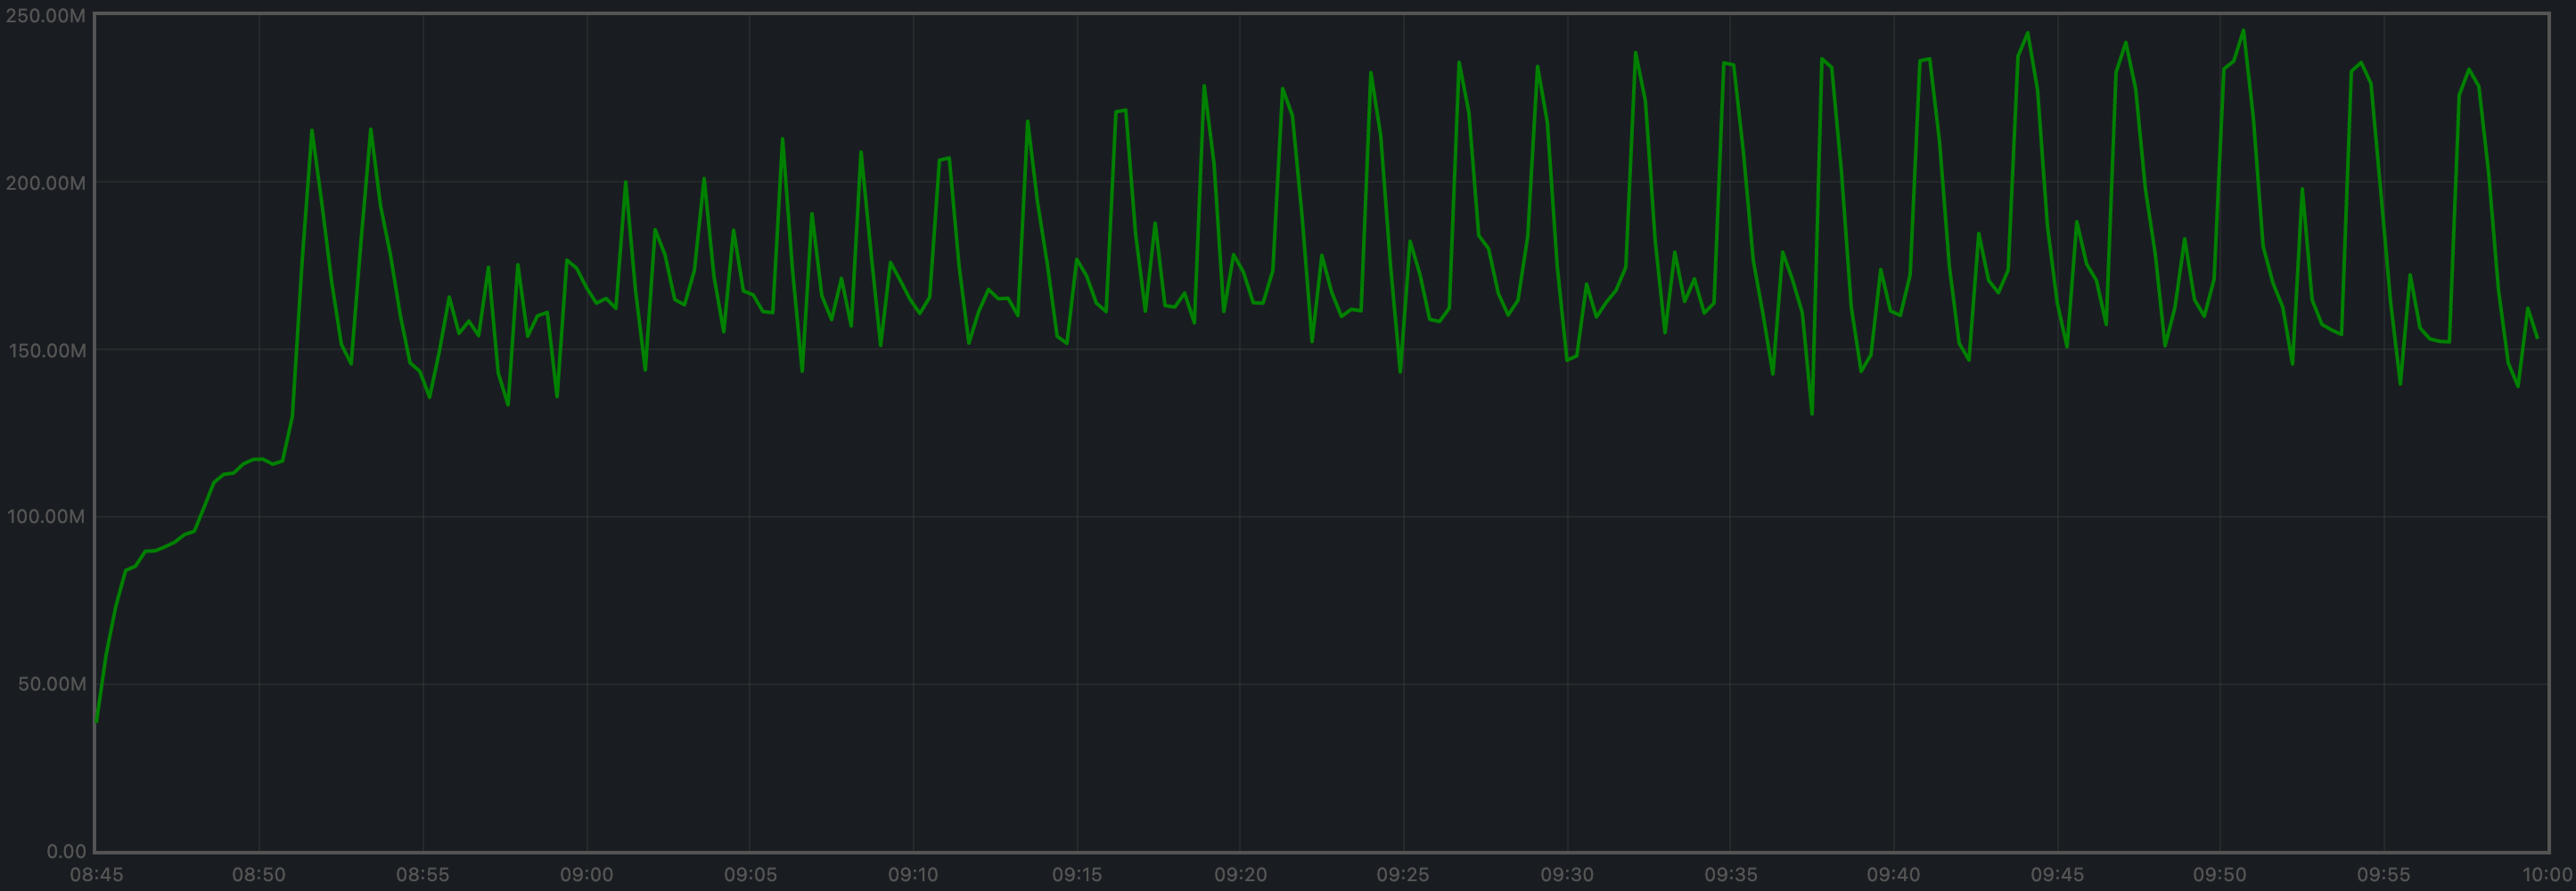
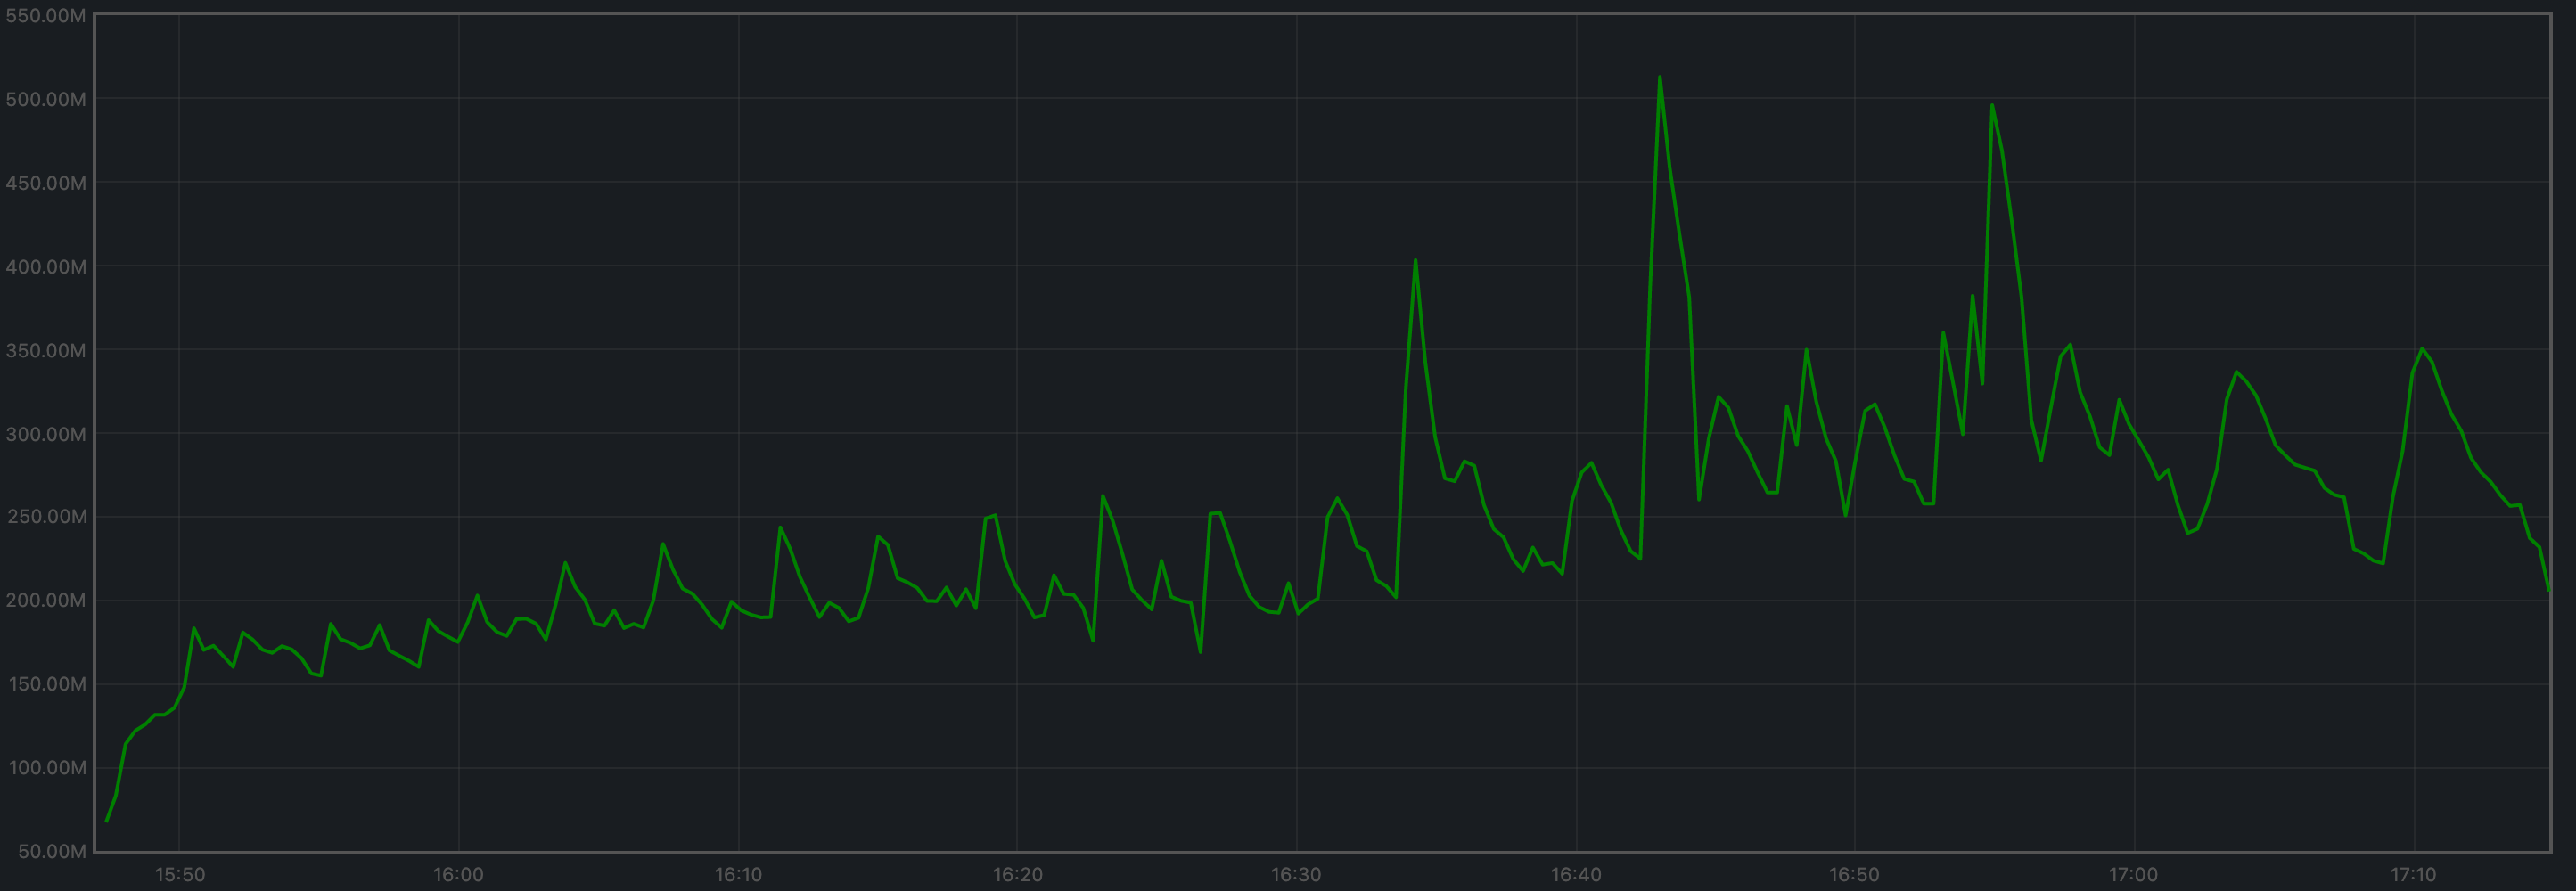 验证者和临时节点在线时占用的内存是可比的(图中未展示),
与基线中的观察结果一致。
验证者和临时节点在线时占用的内存是可比的(图中未展示),
与基线中的观察结果一致。
CPU 利用率
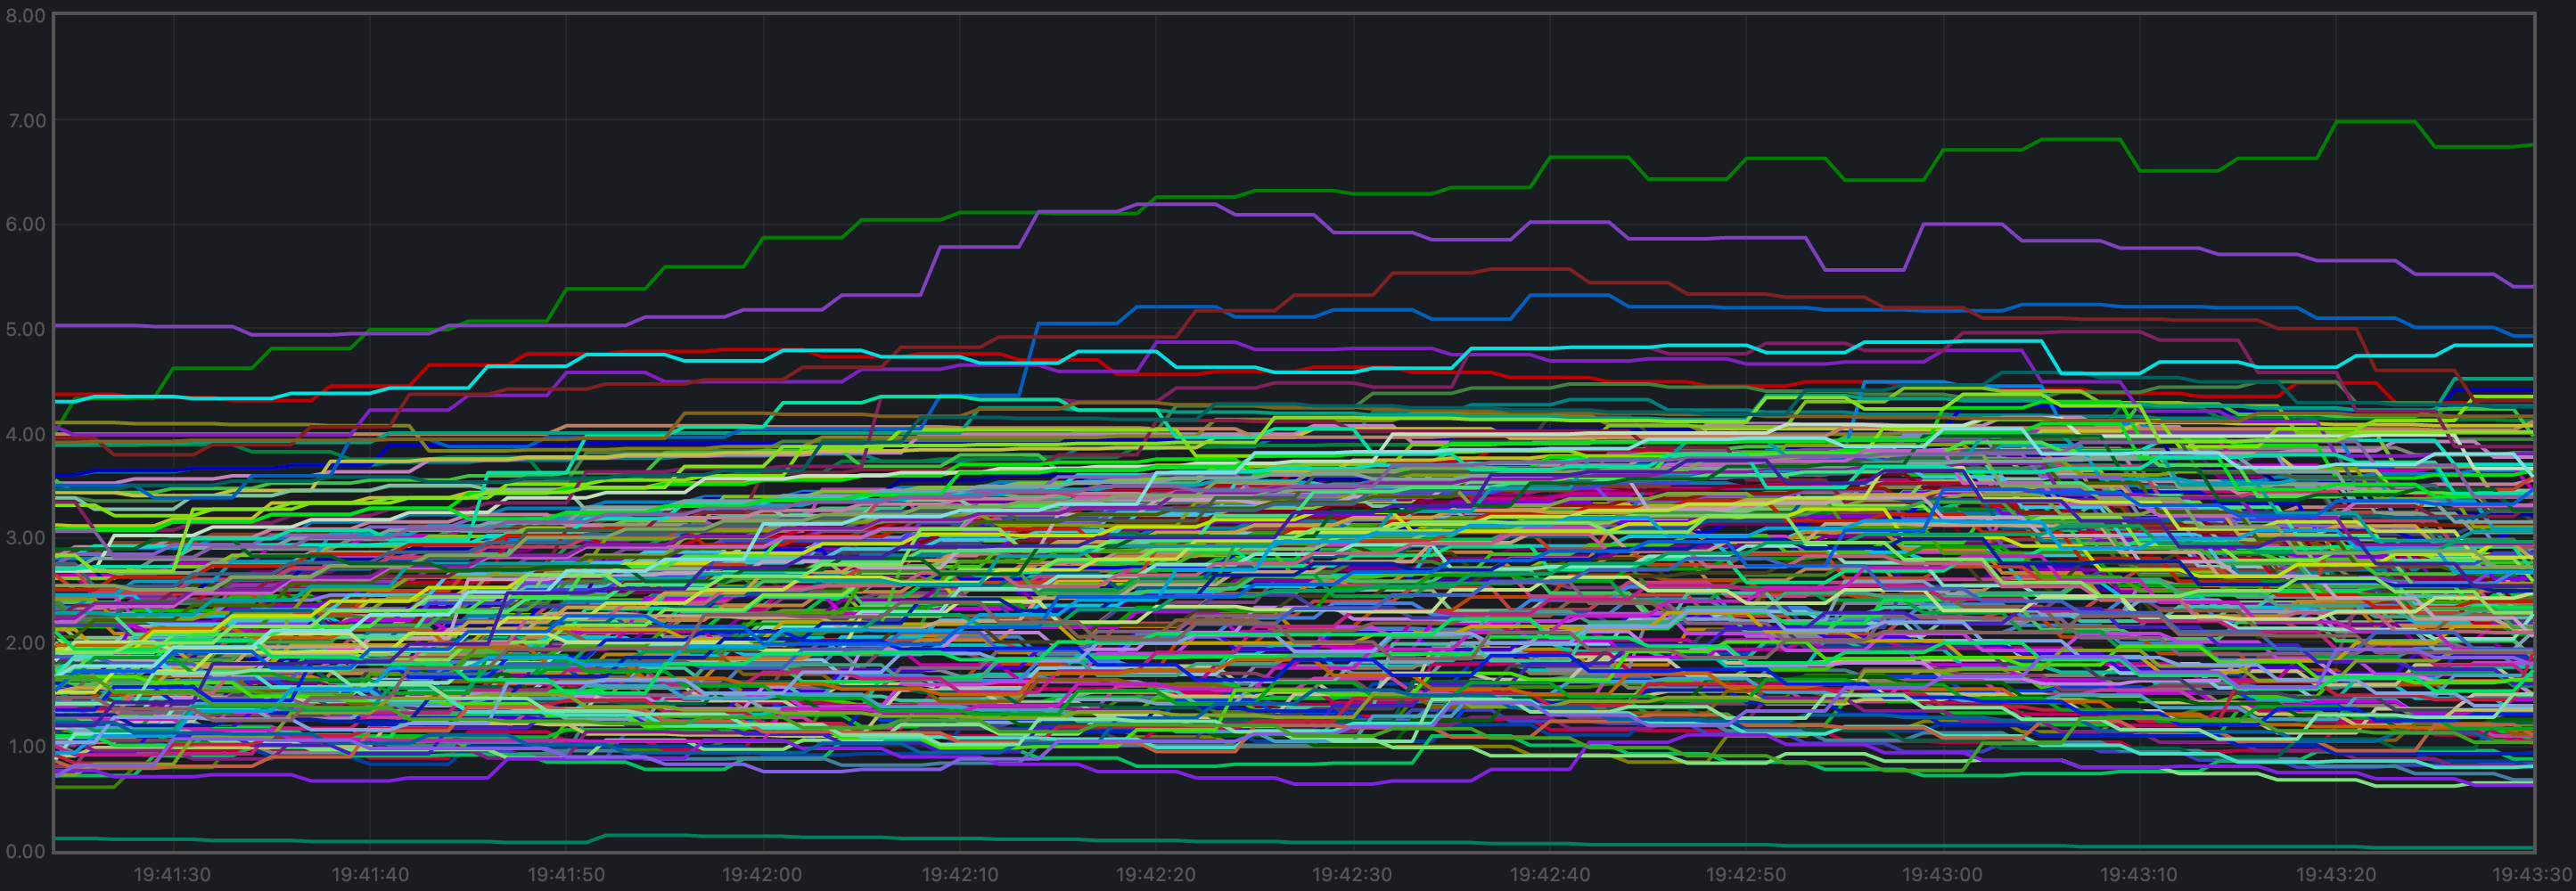
下图展示了所有节点的load1 指标。
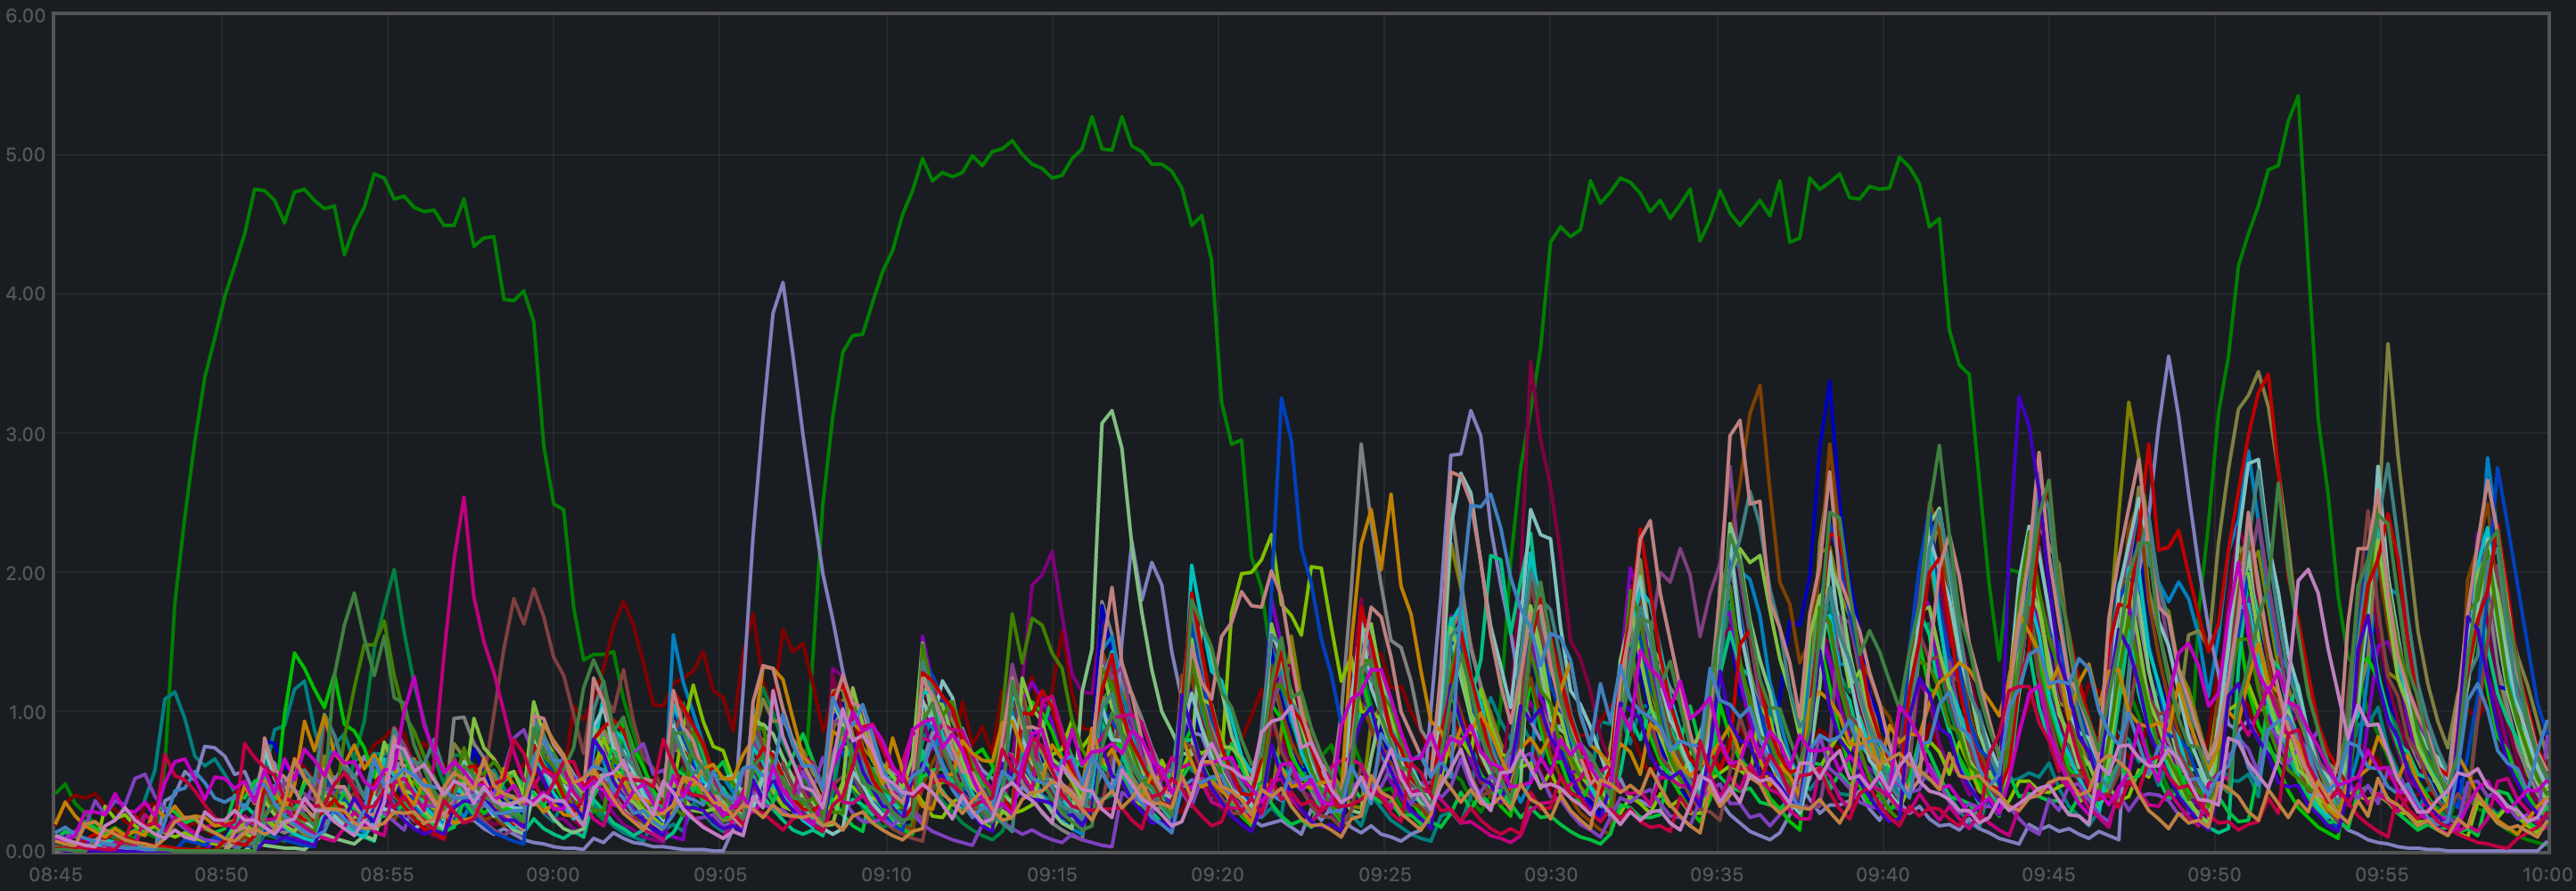
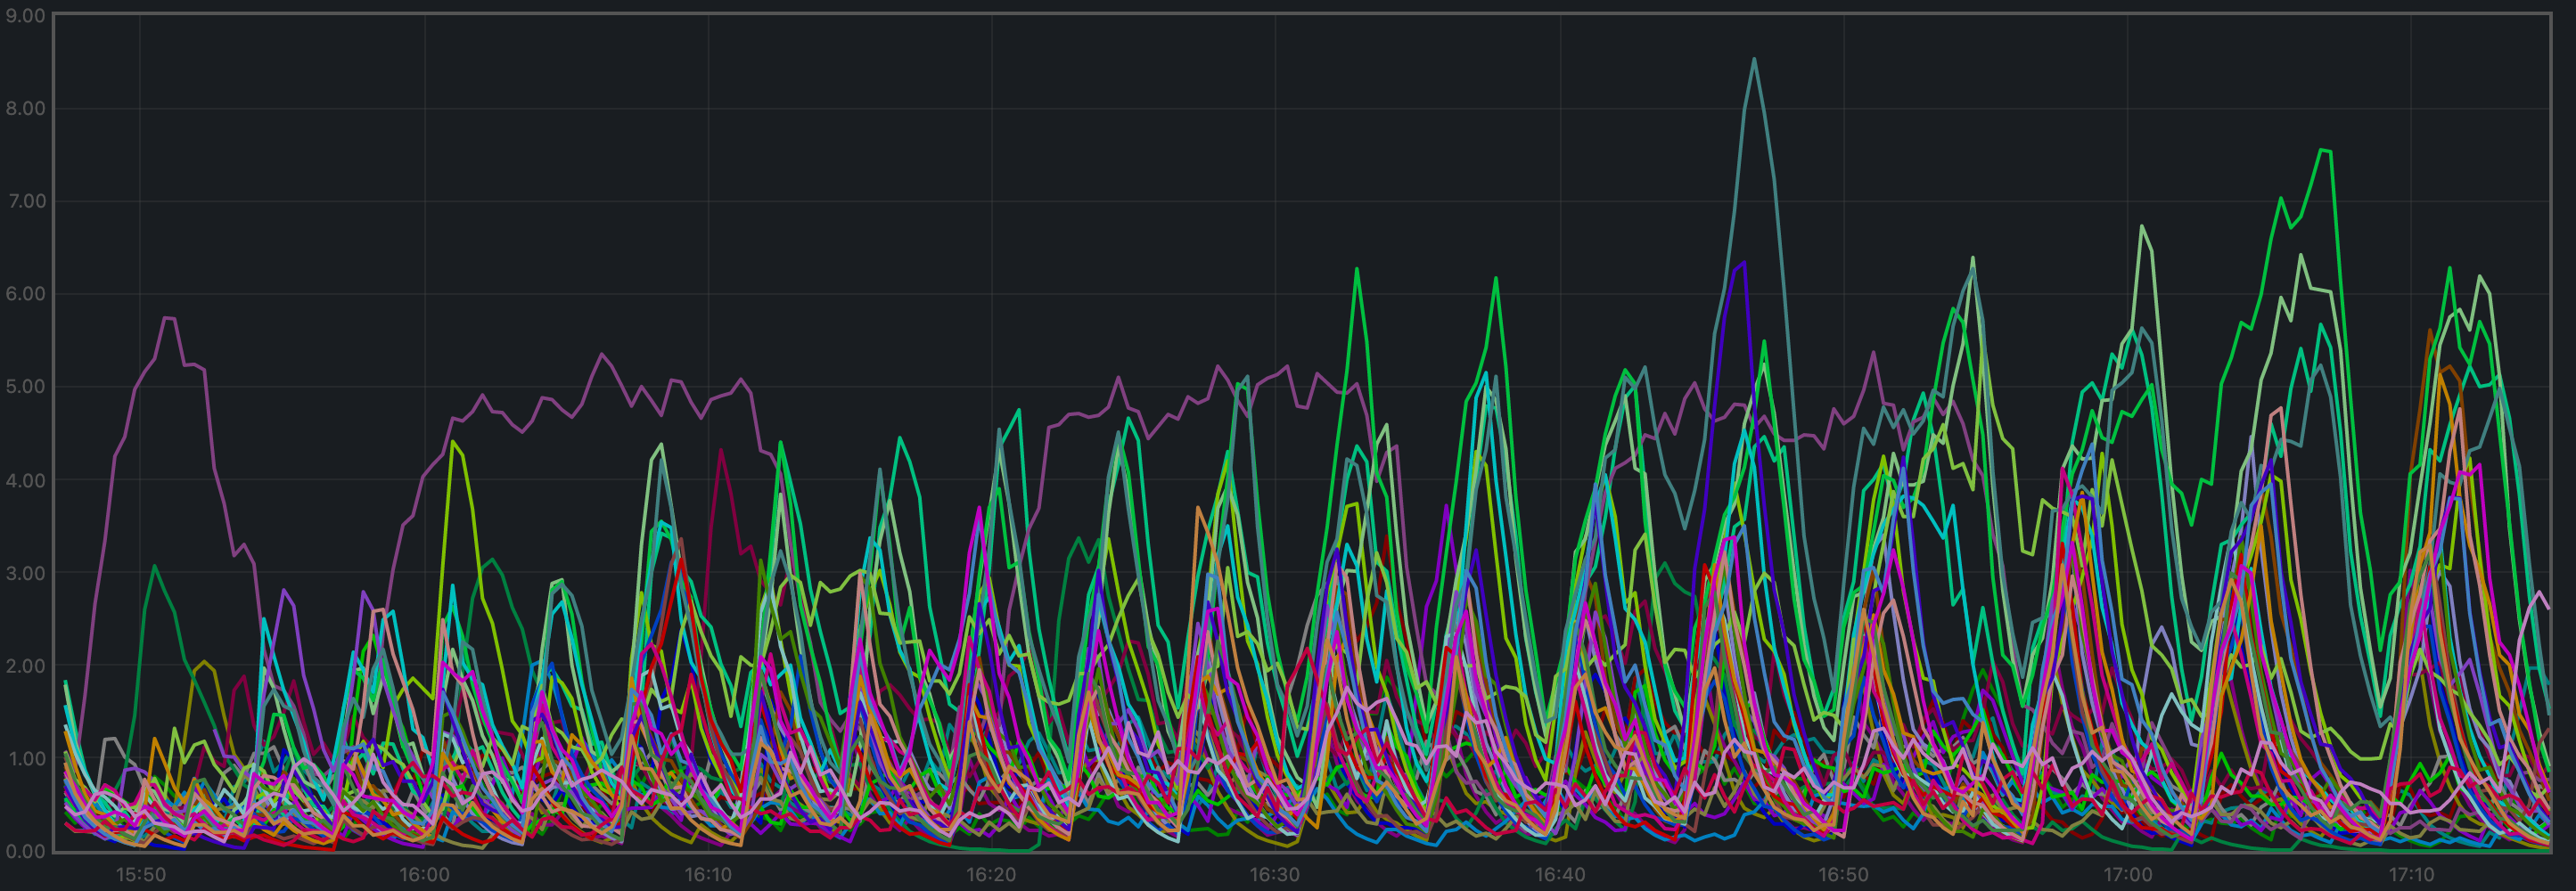 两种情况下,它在大多数时间都保持在 5 以下,这被视为正常负载。
v0.37 图中的绿色曲线和基线图(v0.34)中的紫色曲线
对应的是通过 RPC 从负载生成进程接收全部交易的验证者。
两种情况下,它们都在 5 左右波动(正常负载)。主要区别在于,
v0.37 中其他节点的负载通常更低。
测试结果
结果:通过 日期:2022-10-10 版本:155110007b9d8b83997a799016c1d0844c8efbafTendermint Core QA Results v0.37.x
Issues Discovered
During this iteration of the QA process, the following issues were found:- (critical, fixed) #9533 - This bug caused full nodes to sometimes get stuck when blocksyncing, requiring a manual restart to unblock them. Importantly, this bug was also present in v0.34.x and the fix was also backported in #9534.
- (critical, fixed) #9539 -
loadtimeis very likely to include more than one ”=” character in transactions, which is rejected by the e2e application. - (critical, fixed) #9581 - Absent prometheus label makes CometBFT crash when enabling Prometheus metric collection.
- (non-critical, not fixed) #9548 - Full nodes can go over 50 connected peers, which is not intended by the default configuration.
- (non-critical, not fixed) #9537 - With the default mempool cache setting, duplicated transactions are not rejected when gossiped and eventually flood all mempools. The 200 node testnets were thus run with a value of 200000 (as opposed to the default 10000).
200 Node Testnet
Finding the Saturation Point
The first goal is to identify the saturation point and compare it with the baseline (v0.34.x). For further details, see this paragraph in the baseline version. The following table summarizes the results for v0.37.x for the different experiments (extracted from filev037_report_tabbed.txt).
The X axis of this table is c, the number of connections created by the load runner process to the target node.
The Y axis of this table is r, the rate or number of transactions issued per second.
| c=1 | c=2 | c=4 | |
|---|---|---|---|
| r=25 | 2225 | 4450 | 8900 |
| r=50 | 4450 | 8900 | 17800 |
| r=100 | 8900 | 17800 | 35600 |
| r=200 | 17800 | 35600 | 38660 |
| c=1 | c=2 | c=4 | |
|---|---|---|---|
| r=25 | 2225 | 4450 | 8900 |
| r=50 | 4450 | 8900 | 17800 |
| r=100 | 8900 | 17800 | 35400 |
| r=200 | 17800 | 35600 | 37358 |
r=200,c=2r=100,c=4
r=200,c=2.
The load runner’s CPU load was negligible (near 0) when running r=200,c=2.
Examining Latencies
The method described here allows us to plot the latencies of transactions for all experiments.
The data seen in the plot is similar to that of the baseline.
Therefore, for further details on these plots,
see this paragraph in the baseline version.
The following plot summarizes average latencies versus overall throughputs
across different numbers of WebSocket connections to the node into which
transactions are being loaded.
This is similar to the baseline plot:
Prometheus Metrics on the Chosen Experiment
As mentioned above, the chosen experiment isr=200,c=2.
This section further examines key metrics for this experiment extracted from Prometheus data.
Mempool Size
The mempool size, a count of the number of transactions in the mempool, was shown to be stable and homogeneous at all full nodes. It did not exhibit any unconstrained growth. The plot below shows the evolution over time of the cumulative number of transactions inside all full nodes’ mempools at a given time.
The plot below shows the evolution of the average over all full nodes, which oscillates between 1500 and 2000 outstanding transactions.
The peaks observed coincide with the moments when some nodes reached round 1 of consensus (see below).
These plots yield similar results to the baseline:
Peers
The number of peers was stable at all nodes. It was higher for the seed nodes (around 140) than for the rest (between 16 and 78).
Just as in the baseline, the fact that non-seed nodes reach more than 50 peers is due to #9548.
This plot yields similar results to the baseline:
Consensus Rounds per Height
Most heights took just one round, but some nodes needed to advance to round 1 at some point.
This plot yields slightly better results than the baseline:
Blocks Produced per Minute, Transactions Processed per Minute
The blocks produced per minute are the gradient of this plot.
Over a period of 2 minutes, the height goes from 477 to 524.
This results in an average of 23.5 blocks produced per minute.
The transactions processed per minute are the gradient of this plot.
Over a period of 2 minutes, the total goes from 64525 to 100125 transactions,
resulting in 17800 transactions per minute. However, we can see in the plot that
all transactions in the load are processed long before the two minutes.
If we adjust the time window when transactions are processed (approximately 90 seconds),
we obtain 23733 transactions per minute.
These plots yield similar results to the baseline:
Memory Resident Set Size
Resident Set Size of all monitored processes is plotted below.
The average over all processes oscillates around 380 MiB and does not demonstrate unconstrained growth.
These plots yield similar results to the baseline:
CPU Utilization
The best metric from Prometheus to gauge CPU utilization in a Unix machine isload1,
as it usually appears in the
output of top.
It is contained below 5 on most nodes.
This plot yields similar results to the baseline:
Test Result
Result: PASS Date: 2022-10-14 Version: 1cf9d8e276afe8595cba960b51cd056514965fd1Rotating Node Testnet
We use the same load as in the baseline:c=4,r=800.
Just as in the baseline tests, the version of CometBFT used for these tests is affected by #9539.
See this paragraph in the baseline report for further details.
Finally, note that this setup allows for a fairer comparison between this version and the baseline.
Latencies
The plot of all latencies can be seen here.
This is similar to the baseline.
Note that we are comparing against the baseline plot with unique
transactions. This is because the problem with duplicate transactions
detected during the baseline experiment did not show up for v0.37,
which is not proof that the problem is not present in v0.37.
Prometheus Metrics
The set of metrics shown here match those shown on the baseline (v0.34) for the same experiment.
We also show the baseline results for comparison.
Blocks and Transactions per Minute
The blocks produced per minute are the gradient of this plot.
Over a period of 4446 seconds, the height goes from 5 to 3323.
This results in an average of 45 blocks produced per minute,
which is similar to the baseline, shown below.
The following two plots show only the heights reported by ephemeral nodes.
The second plot is the baseline plot for comparison.
By the length of the segments, we can see that ephemeral nodes in v0.37
catch up slightly faster.
The transactions processed per minute are the gradient of this plot.
Over a period of 3852 seconds, the total goes from 597 to 267298 transactions in one of the validators,
resulting in 4154 transactions per minute, which is slightly lower than the baseline,
although the baseline had to deal with duplicate transactions.
For comparison, this is the baseline plot.
Peers
The plot below shows the evolution of the number of peers throughout the experiment.
This is the baseline plot, for comparison.
The plotted values and their evolution are comparable in both plots.
For further details on these plots, see the baseline report.
Memory Resident Set Size
The average Resident Set Size (RSS) over all processes looks slightly more stable onv0.37 (first plot) than on the baseline (second plot).
The memory taken by the validators and the ephemeral nodes when they are up is comparable (not shown in the plots),
just as observed in the baseline.
CPU Utilization
The plot shows metricload1 for all nodes.
In both cases, it is contained under 5 most of the time, which is considered normal load.
The green line in the v0.37 plot and the purple line in the baseline plot (v0.34)
correspond to the validators receiving all transactions, via RPC, from the load runner process.
In both cases, they oscillate around 5 (normal load). The main difference is that other
nodes are generally less loaded in v0.37.