

CometBFT QA 结果 v0.37.x
本轮 QA 基于 CometBFTv0.37.0-alpha3 运行,这是 CometBFT 仓库中的首个 v0.37.x 版本。
相对于基线版本,即截至 2022 年 10 月 12 日的 TM v0.37.x(提交:1cf9d8e276afe8595cba960b51cd056514965fd1),变更包括将我们的 Tendermint Core 分叉重新命名为 CometBFT,以及若干改进,详见 CometBFT CHANGELOG。
测试环境
与 QA 流程的其他轮次一样,我们使用了一个由 200 个节点组成的网络作为测试环境,并额外部署了一些节点用于施加负载和收集指标。饱和点
与之前的轮次一样,在 QA 实验中,系统承受的是略低于饱和点的负载。 用于识别饱和点的方法见这里,其在基线中的应用见这里。 我们沿用了相同的饱和点,也就是说,c(负载发起进程与目标节点建立的连接数)为 2,r(每秒发送的交易速率或交易数量)为 200。
延迟分析
下图展示了在该网络上进行的 6 次实验。 每次执行的唯一标识符(UUID)标注在各图顶部。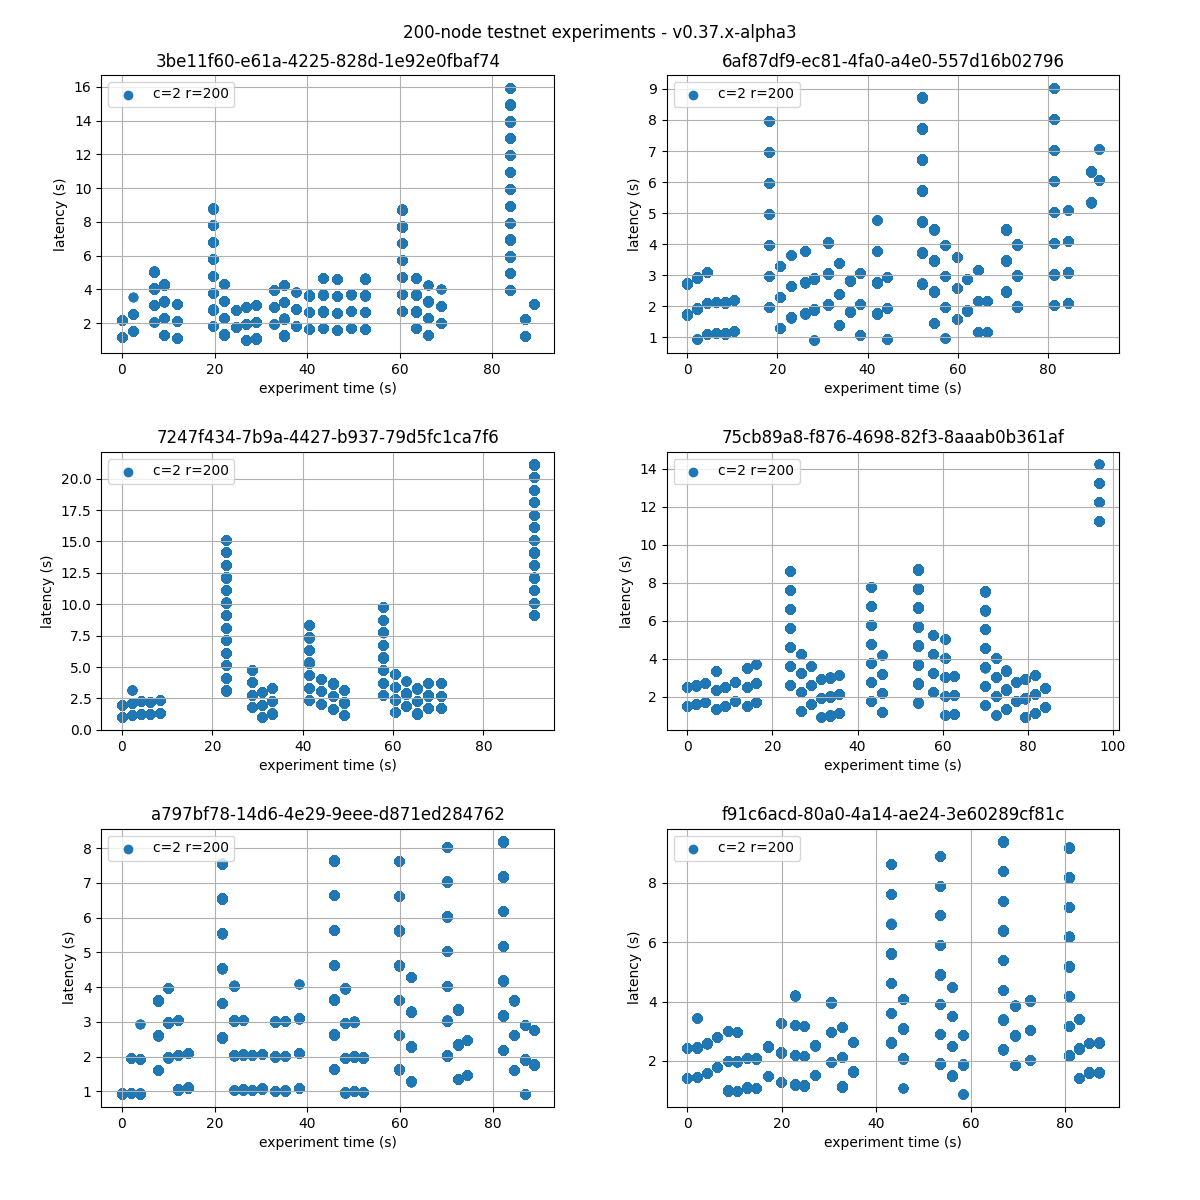 可以看到,各次实验的延迟表现出可比的模式。
因此,在后续章节中,我们只展示一次具有代表性的运行结果。该运行是随机选取的,其 UUID 以
可以看到,各次实验的延迟表现出可比的模式。
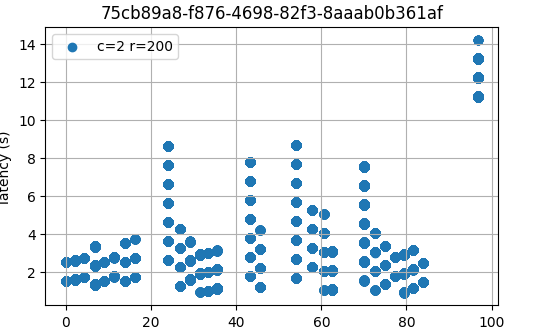
因此,在后续章节中,我们只展示一次具有代表性的运行结果。该运行是随机选取的,其 UUID 以 75cb89a8 开头。
 作为参考,下图展示了基线在不同配置下的延迟情况。
其中,
作为参考,下图展示了基线在不同配置下的延迟情况。
其中,c=02 r=200 对应于本实验的相同配置。
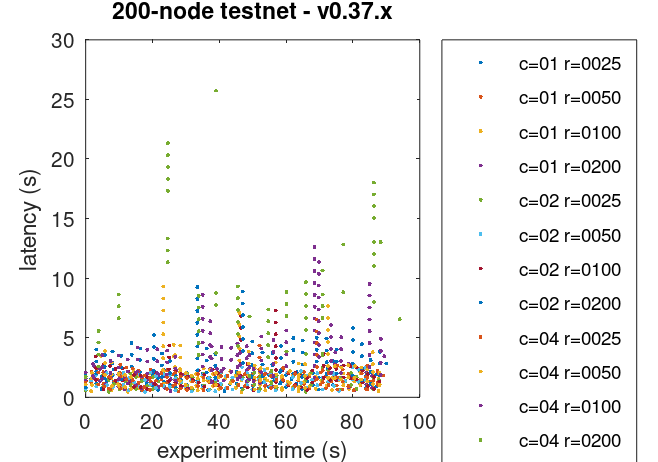 可以看到,延迟表现相近。
所选实验中的 Prometheus 指标
本节基于 Prometheus 数据,进一步分析所选实验中的关键指标。Mempool 大小
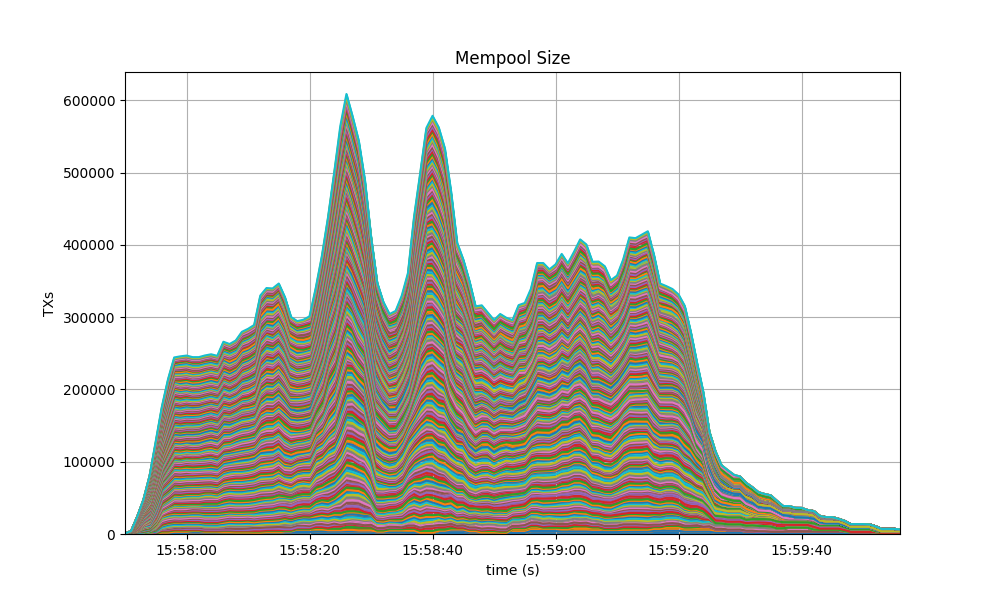
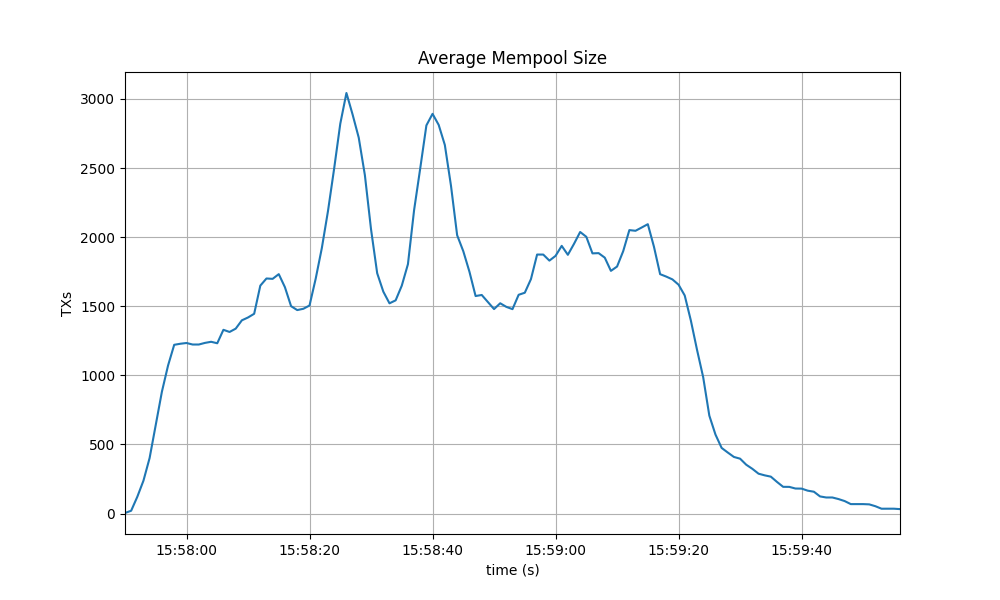
Mempool 大小,即 mempool 中交易数量的计数,在所有全节点上都表现稳定且分布均匀。 没有出现任何不受约束的增长。 下图展示了某一时刻所有全节点 mempool 中交易累计数量随时间的变化。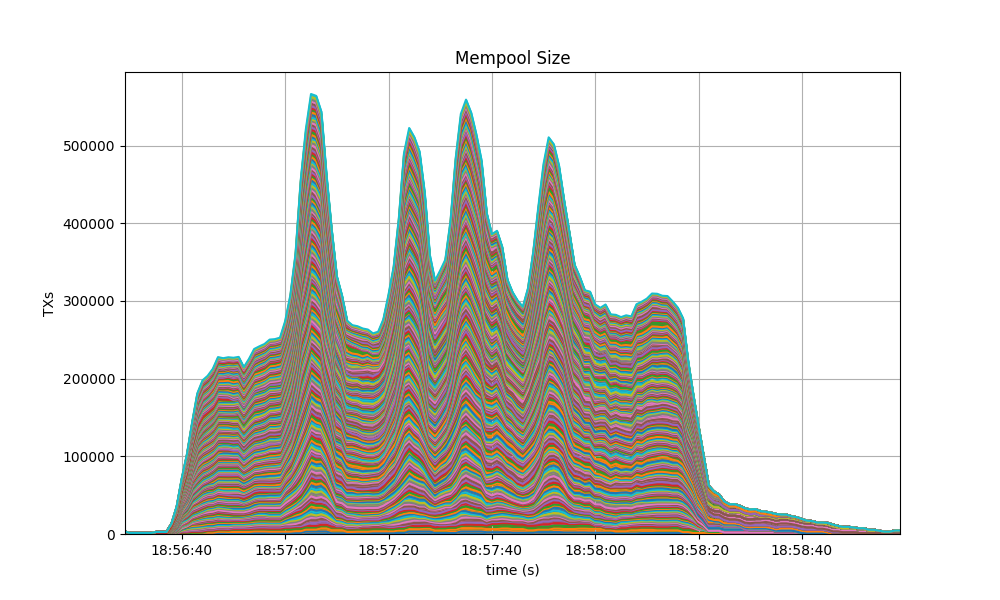 下图展示了所有全节点平均 mempool 大小的变化,其值大多在 1500 到 2000 笔待处理交易之间波动。
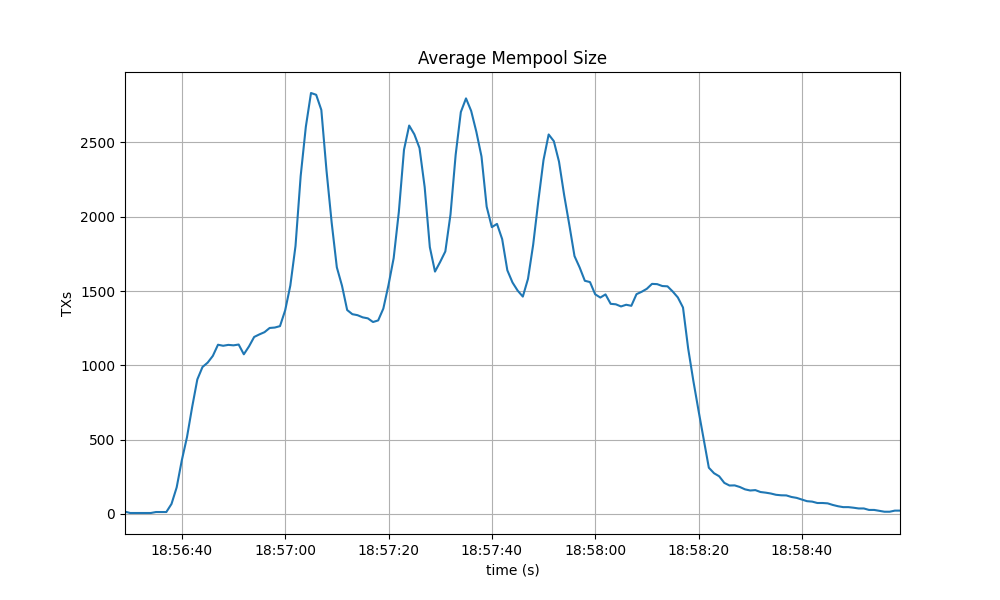 观察到的峰值与某些节点进入共识第 1 轮的时刻一致(见下文)。
这种行为与基线中的观察结果相似,见下图。
观察到的峰值与某些节点进入共识第 1 轮的时刻一致(见下文)。
这种行为与基线中的观察结果相似,见下图。
对等节点
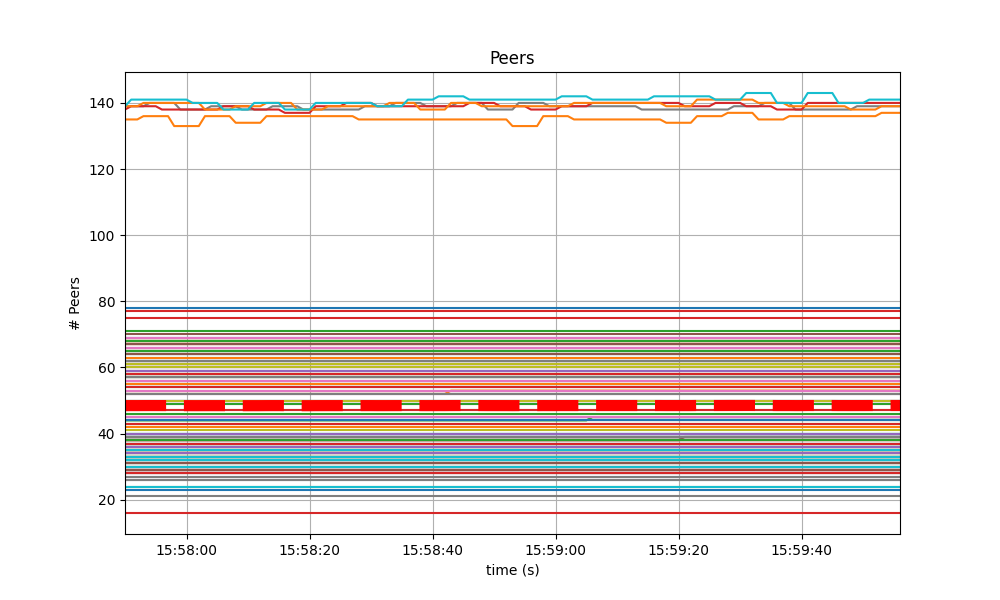
所有节点上的对等节点数量都很稳定。 种子节点的数量更高(约 140),其余节点则在 16 到 78 之间。 红色虚线表示平均值。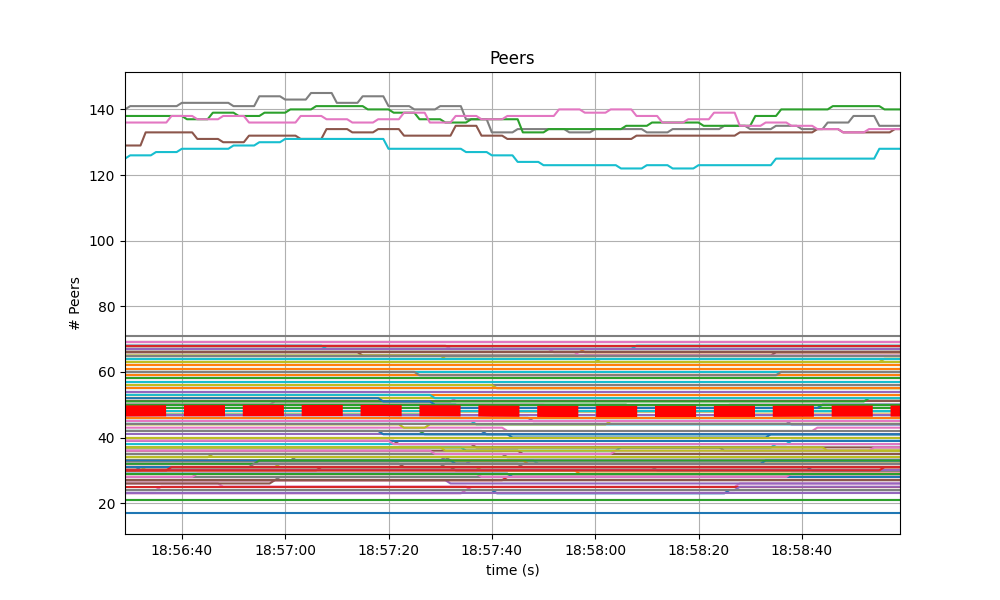 与下方展示的基线一样,非种子节点能达到超过 50 个对等节点,是由 #9548 导致的。
每个高度的共识轮次
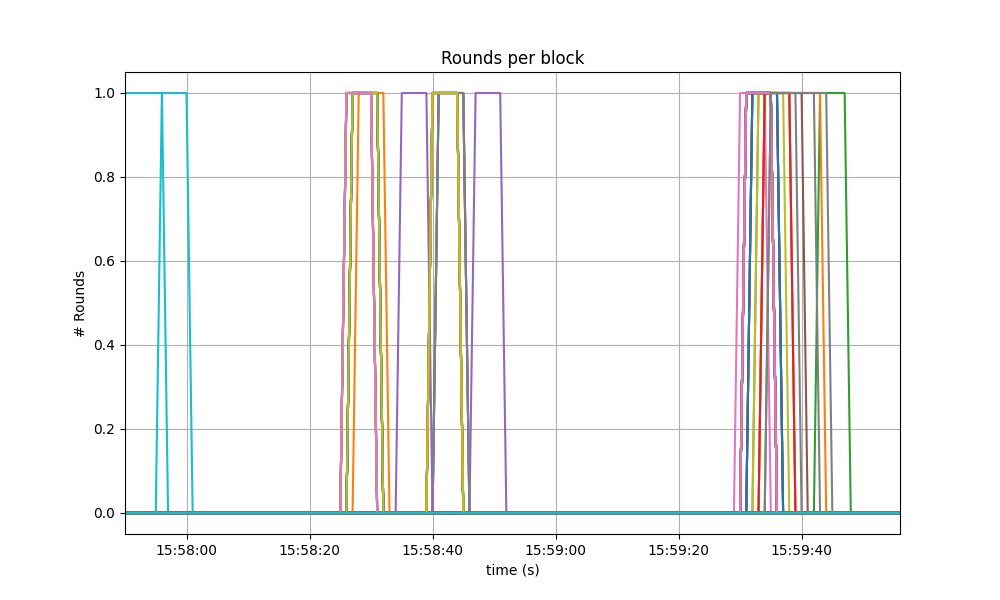
大多数高度只需一轮,也就是第 0 轮,但有些节点需要推进到第 1 轮,最终甚至到第 2 轮。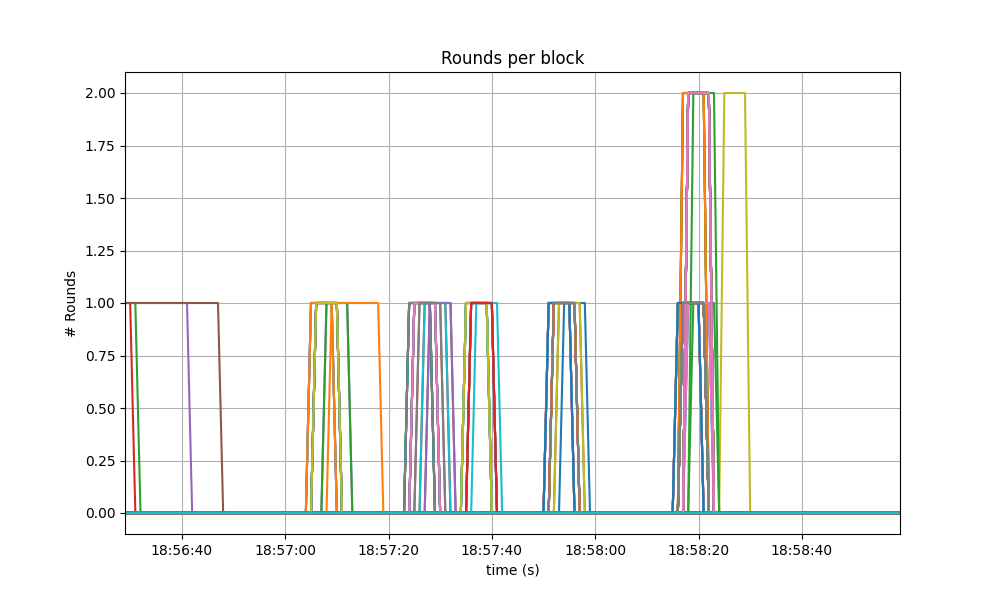 下方展示的基线中的该次具体运行结果更好,只需要到第 1 轮;不过在对应的软件版本中,出现更高轮次并不罕见。
每分钟产生的区块数、每分钟处理的交易数
下图展示了从各节点视角看到的区块生成速率。 也就是说,它展示了每个节点何时获知一个新区块已经达成共识。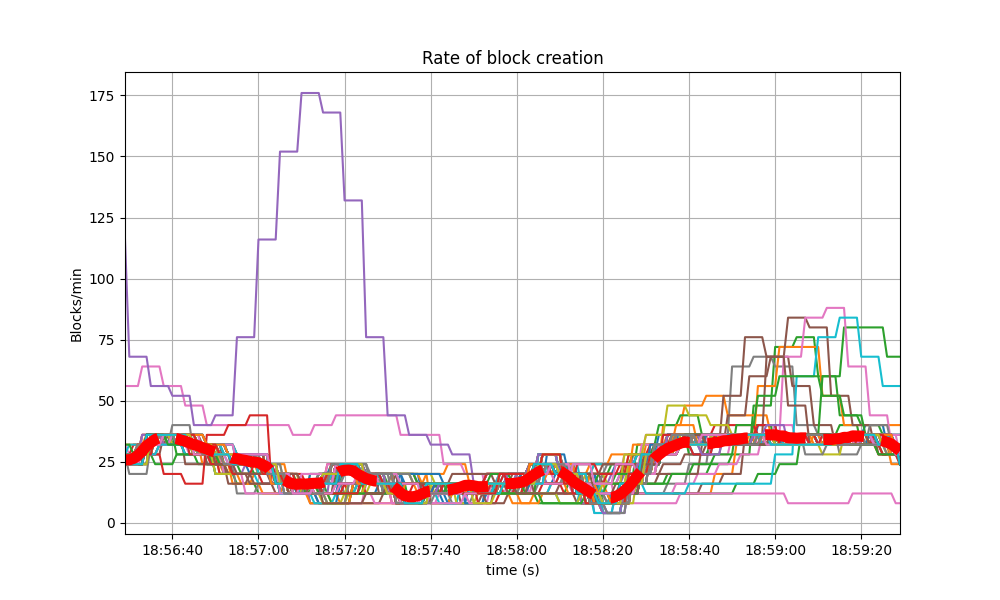 在系统承受负载的大部分时间里,大多数节点保持在每分钟约 20 到 25 个区块。
超过每分钟 175 个区块的尖峰是由于某个较慢的节点在追赶进度。
图右侧的集体尖峰标志着负载注入结束,此时区块变得更小(为空块),对网络施加的压力更小。
这一行为也体现在下图中,该图展示了每分钟处理的交易数量。
在系统承受负载的大部分时间里,大多数节点保持在每分钟约 20 到 25 个区块。
超过每分钟 175 个区块的尖峰是由于某个较慢的节点在追赶进度。
图右侧的集体尖峰标志着负载注入结束,此时区块变得更小(为空块),对网络施加的压力更小。
这一行为也体现在下图中,该图展示了每分钟处理的交易数量。
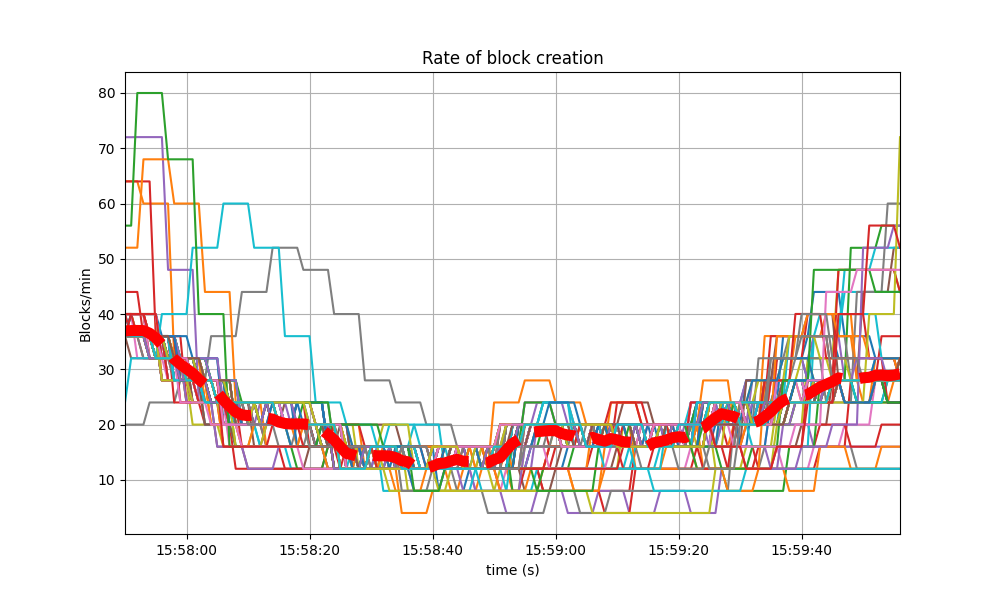
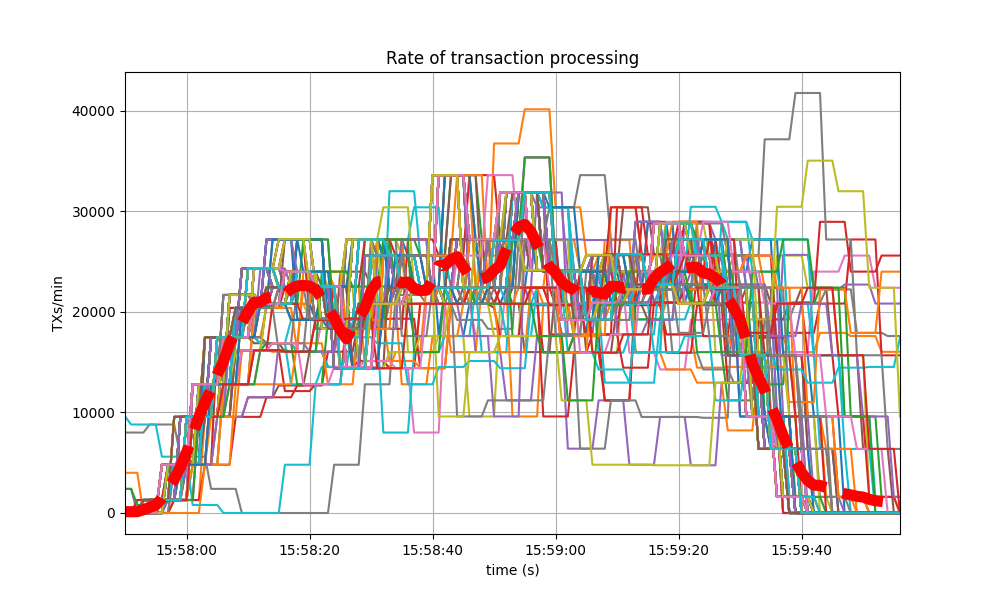
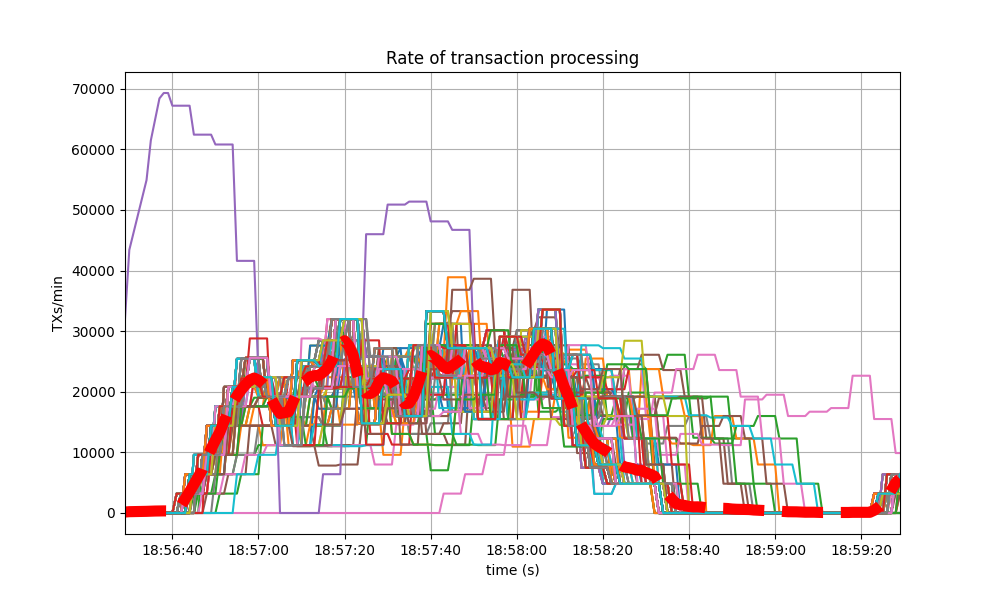 基线中也观察到了类似行为,如下两图所示。
第一张展示区块速率。
基线中也观察到了类似行为,如下两图所示。
第一张展示区块速率。
 第二张展示交易速率。
常驻内存集大小
下图绘制了所有受监控进程的常驻内存集大小(Resident Set Size),最大内存使用量为 2GB。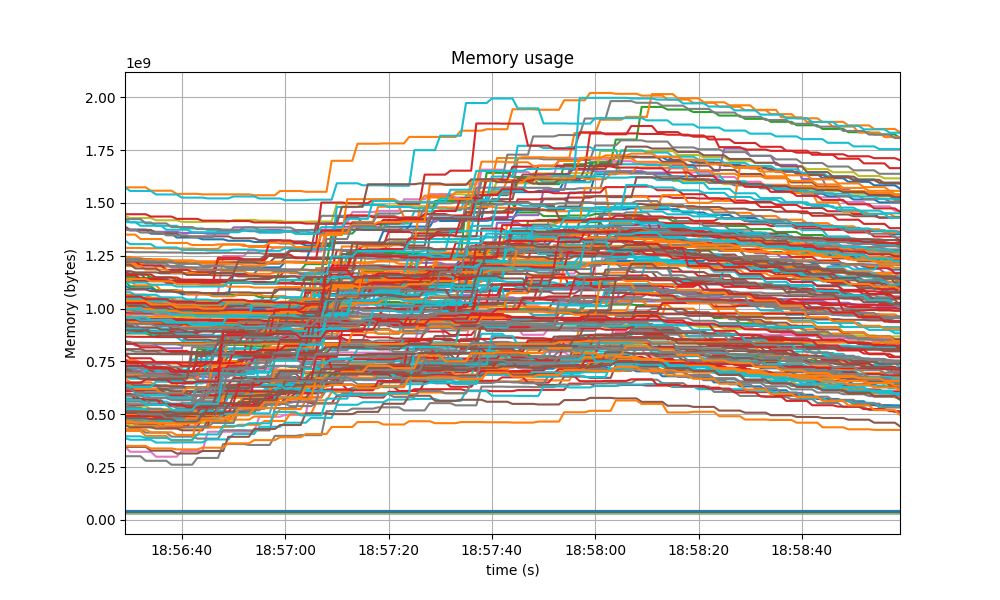 基线中也呈现出类似行为,如下图所示。
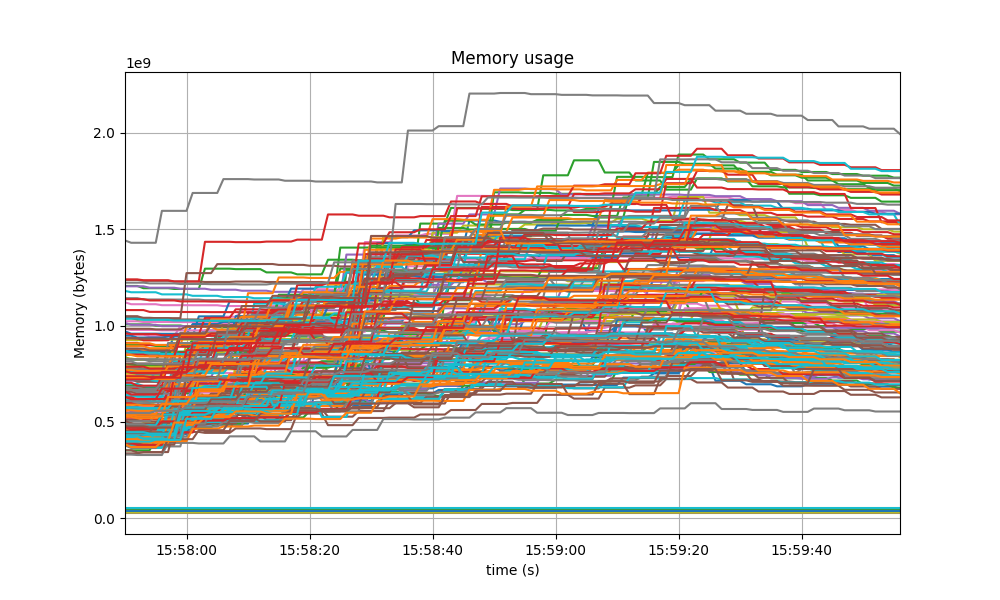 随着负载移除,所有进程的内存占用均有所下降,未显示出不受约束增长的迹象。
CPU 利用率
在 Unix 机器上,用于衡量 CPU 利用率的最佳 Prometheus 指标是load1,
因为它通常会出现在
top 的输出中。
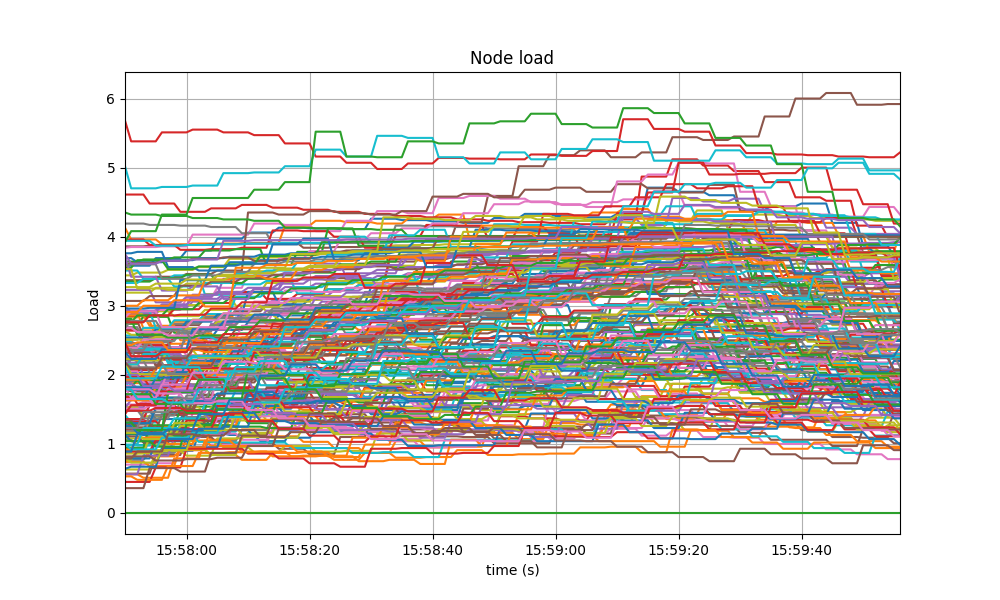
如下面的图所示,大多数节点的该值都低于 5。
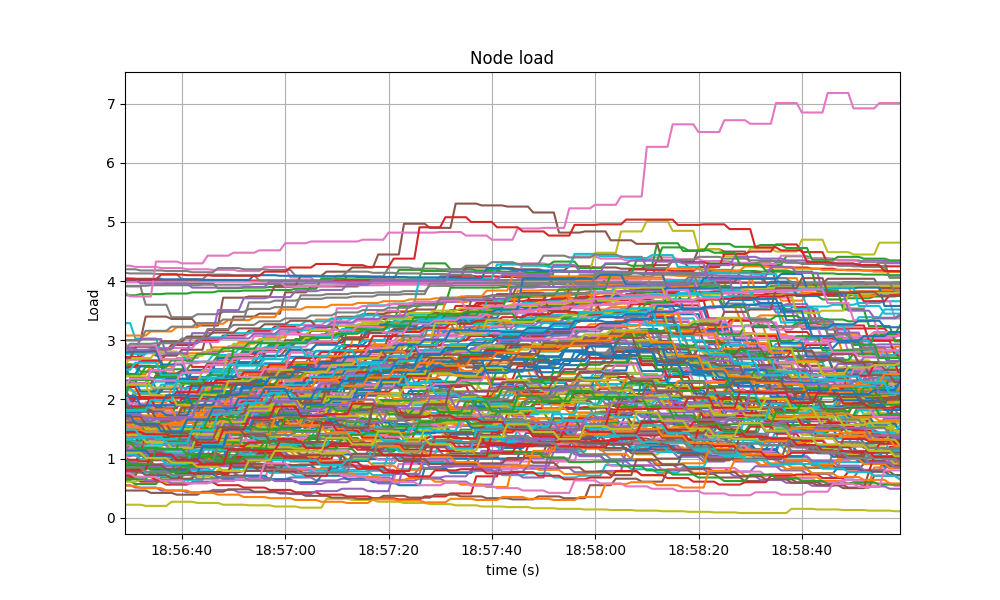 基线中也观察到了类似行为。
测试结果
与基线结果的比较表明,两种场景的数值相近,因此可以认为二者等价。 下表给出了这些测试的结论,以及实验中使用的提交版本。| 场景 | 日期 | 版本 | 结果 |
|---|---|---|---|
| CometBFT | 2023-02-14 | v0.37.0-alpha3 (bef9a830e7ea7da30fa48f2cc236b1f465cc5833) | 通过 |
CometBFT QA 结果 v0.37.x
本轮 QA 基于 CometBFTv0.37.0-alpha3 运行,这是 CometBFT 仓库中的首个 v0.37.x 版本。
相对于基线版本,即截至 2022 年 10 月 12 日的 TM v0.37.x(提交:1cf9d8e276afe8595cba960b51cd056514965fd1),变更包括将我们的 Tendermint Core 分叉重新命名为 CometBFT,以及若干改进,详见 CometBFT CHANGELOG。
测试环境
与 QA 流程的其他轮次一样,我们使用了一个由 200 个节点组成的网络作为测试环境,并额外部署了一些节点用于施加负载和收集指标。饱和点
与之前的轮次一样,在 QA 实验中,系统承受的是略低于饱和点的负载。 用于识别饱和点的方法见这里,其在基线中的应用见这里。 我们沿用了相同的饱和点,也就是说,c(负载发起进程与目标节点建立的连接数)为 2,r(每秒发送的交易速率或交易数量)为 200。
延迟分析
下图展示了在该网络上进行的 6 次实验。 每次执行的唯一标识符(UUID)标注在各图顶部。
可以看到,各次实验的延迟表现出可比的模式。
因此,在后续章节中,我们只展示一次具有代表性的运行结果。该运行是随机选取的,其 UUID 以 75cb89a8 开头。
作为参考,下图展示了基线在不同配置下的延迟情况。
其中,c=02 r=200 对应于本实验的相同配置。
可以看到,延迟表现相近。
所选实验中的 Prometheus 指标
本节基于 Prometheus 数据,进一步分析所选实验中的关键指标。Mempool 大小
Mempool 大小,即 mempool 中交易数量的计数,在所有全节点上都表现稳定且分布均匀。 没有出现任何不受约束的增长。 下图展示了某一时刻所有全节点 mempool 中交易累计数量随时间的变化。
下图展示了所有全节点平均 mempool 大小的变化,其值大多在 1500 到 2000 笔待处理交易之间波动。
观察到的峰值与某些节点进入共识第 1 轮的时刻一致(见下文)。
这种行为与基线中的观察结果相似,见下图。
对等节点
所有节点上的对等节点数量都很稳定。 种子节点的数量更高(约 140),其余节点则在 16 到 78 之间。 红色虚线表示平均值。
与下方展示的基线一样,非种子节点能达到超过 50 个对等节点,是由 #9548 导致的。
每个高度的共识轮次
大多数高度只需一轮,也就是第 0 轮,但有些节点需要推进到第 1 轮,最终甚至到第 2 轮。
下方展示的基线中的该次具体运行结果更好,只需要到第 1 轮;不过在对应的软件版本中,出现更高轮次并不罕见。
每分钟产生的区块数、每分钟处理的交易数
下图展示了从各节点视角看到的区块生成速率。 也就是说,它展示了每个节点何时获知一个新区块已经达成共识。
在系统承受负载的大部分时间里,大多数节点保持在每分钟约 20 到 25 个区块。
超过每分钟 175 个区块的尖峰是由于某个较慢的节点在追赶进度。
图右侧的集体尖峰标志着负载注入结束,此时区块变得更小(为空块),对网络施加的压力更小。
这一行为也体现在下图中,该图展示了每分钟处理的交易数量。
基线中也观察到了类似行为,如下两图所示。
第一张展示区块速率。
第二张展示交易速率。
常驻内存集大小
下图绘制了所有受监控进程的常驻内存集大小(Resident Set Size),最大内存使用量为 2GB。
基线中也呈现出类似行为,如下图所示。
随着负载移除,所有进程的内存占用均有所下降,未显示出不受约束增长的迹象。
CPU 利用率
在 Unix 机器上,用于衡量 CPU 利用率的最佳 Prometheus 指标是load1,
因为它通常会出现在
top 的输出中。
如下面的图所示,大多数节点的该值都低于 5。
基线中也观察到了类似行为。
测试结果
与基线结果的比较表明,两种场景的数值相近,因此可以认为二者等价。 下表给出了这些测试的结论,以及实验中使用的提交版本。| 场景 | 日期 | 版本 | 结果 |
|---|---|---|---|
| CometBFT | 2023-02-14 | v0.37.0-alpha3 (bef9a830e7ea7da30fa48f2cc236b1f465cc5833) | 通过 |
CometBFT QA Results v0.37.x
This iteration of the QA was run on CometBFTv0.37.0-alpha3, the first v0.37.x version from the CometBFT repository.
The changes with respect to the baseline, TM v0.37.x as of Oct 12, 2022 (Commit: 1cf9d8e276afe8595cba960b51cd056514965fd1), include the rebranding of our fork of Tendermint Core to CometBFT and several improvements, described in the CometBFT CHANGELOG.
Testbed
As in other iterations of our QA process, we have used a 200-node network as a testbed, plus nodes to introduce load and collect metrics.Saturation Point
As in previous iterations, in our QA experiments, the system is subjected to a load slightly under a saturation point. The method to identify the saturation point is explained here and its application to the baseline is described here. We use the same saturation point, that is,c, the number of connections created by the load runner process to the target node, is 2 and r, the rate or number of transactions issued per second, is 200.
Examining Latencies
The following figure plots six experiments carried out with the network. Unique identifiers (UUIDs) for each execution are presented on top of each graph.
We can see that the latencies follow comparable patterns across all experiments.
Therefore, in the following sections we will only present the results for one representative run, chosen randomly, with UUID starting with 75cb89a8.
For reference, the following figure shows the latencies of different configurations of the baseline.
c=02 r=200 corresponds to the same configuration as in this experiment.
As can be seen, latencies are similar.
Prometheus Metrics on the Chosen Experiment
This section further examines key metrics for this experiment extracted from Prometheus data regarding the chosen experiment.Mempool Size
The mempool size, a count of the number of transactions in the mempool, was shown to be stable and homogeneous at all full nodes. It did not exhibit any unconstrained growth. The plot below shows the evolution over time of the cumulative number of transactions inside all full nodes’ mempools at a given time.
The following picture shows the evolution of the average mempool size over all full nodes, which mostly oscillates between 1500 and 2000 outstanding transactions.
The peaks observed coincide with the moments when some nodes reached round 1 of consensus (see below).
The behavior is similar to that observed in the baseline, presented next.
Peers
The number of peers was stable at all nodes. It was higher for the seed nodes (around 140) than for the rest (between 16 and 78). The red dashed line denotes the average value.
Just as in the baseline, shown next, the fact that non-seed nodes reach more than 50 peers is due to #9548.
Consensus Rounds per Height
Most heights took just one round, that is, round 0, but some nodes needed to advance to round 1 and eventually round 2.
The following specific run of the baseline presented better results, only requiring up to round 1, but reaching higher rounds is not uncommon in the corresponding software version.
Blocks Produced per Minute, Transactions Processed per Minute
The following plot shows the rate at which blocks were created, from the point of view of each node. That is, it shows when each node learned that a new block had been agreed upon.
For most of the time when load was being applied to the system, most of the nodes stayed around 20 to 25 blocks/minute.
The spike to more than 175 blocks/minute is due to a slow node catching up.
The collective spike on the right of the graph marks the end of the load injection, when blocks become smaller (empty) and impose less strain on the network.
This behavior is reflected in the following graph, which shows the number of transactions processed per minute.
The baseline experienced a similar behavior, shown in the following two graphs.
The first depicts the block rate.
The second plots the transaction rate.
Memory Resident Set Size
The Resident Set Size of all monitored processes is plotted below, with maximum memory usage of 2GB.
A similar behavior was shown in the baseline, presented next.
The memory of all processes went down as the load was removed, showing no signs of unconstrained growth.
CPU Utilization
The best metric from Prometheus to gauge CPU utilization in a Unix machine isload1,
as it usually appears in the
output of top.
It is contained below 5 on most nodes, as seen in the following graph.
A similar behavior was seen in the baseline.
Test Results
The comparison against the baseline results shows that both scenarios had similar numbers and are therefore equivalent. A conclusion of these tests is shown in the following table, along with the commit versions used in the experiments.| Scenario | Date | Version | Result |
|---|---|---|---|
| CometBFT | 2023-02-14 | v0.37.0-alpha3 (bef9a830e7ea7da30fa48f2cc236b1f465cc5833) | Pass |