

Tendermint Core QA 测试结果 v0.34.x
200 节点测试网
寻找饱和点
在检查测试结果时,首要目标是识别饱和点。 饱和点指的是一种交易负载足够高、以至于测试网无法保持稳定的配置: 负载生成器试图产生略多于测试网可处理数量的交易。 下表汇总了 v0.34.x 在不同实验中的结果 (摘自文件v034_report_tabbed.txt)。
该表的 X 轴是 c,表示负载生成器进程到目标节点创建的连接数。
该表的 Y 轴是 r,表示每秒发送的交易速率或数量。
| c=1 | c=2 | c=4 | |
|---|---|---|---|
| r=25 | 2225 | 4450 | 8900 |
| r=50 | 4450 | 8900 | 17800 |
| r=100 | 8900 | 17800 | 35600 |
| r=200 | 17800 | 35600 | 38660 |
WebSocket 连接数(c),以及负载生成器尝试产生的每秒交易数(r)。请注意,该工具尝试生成的总体负载为 。
我们可以看到,饱和点位于跨越以下单元格的对角线之外:
r=200,c=2r=100,c=4
r=200,c=4)都有一个共同点:处理的交易总数明显低于 (89 秒,因为最后一批交易从未发送),而这个值是在系统能够良好承载负载时预期的交易数量。
在(r=200,c=4)条件下,我们得到 38660,而理论上的交易数量应为
。
此时,我们选择了一个位于饱和对角线边界上的实验,
以便进一步研究该版本的性能。
所选实验为(r=200,c=2)。
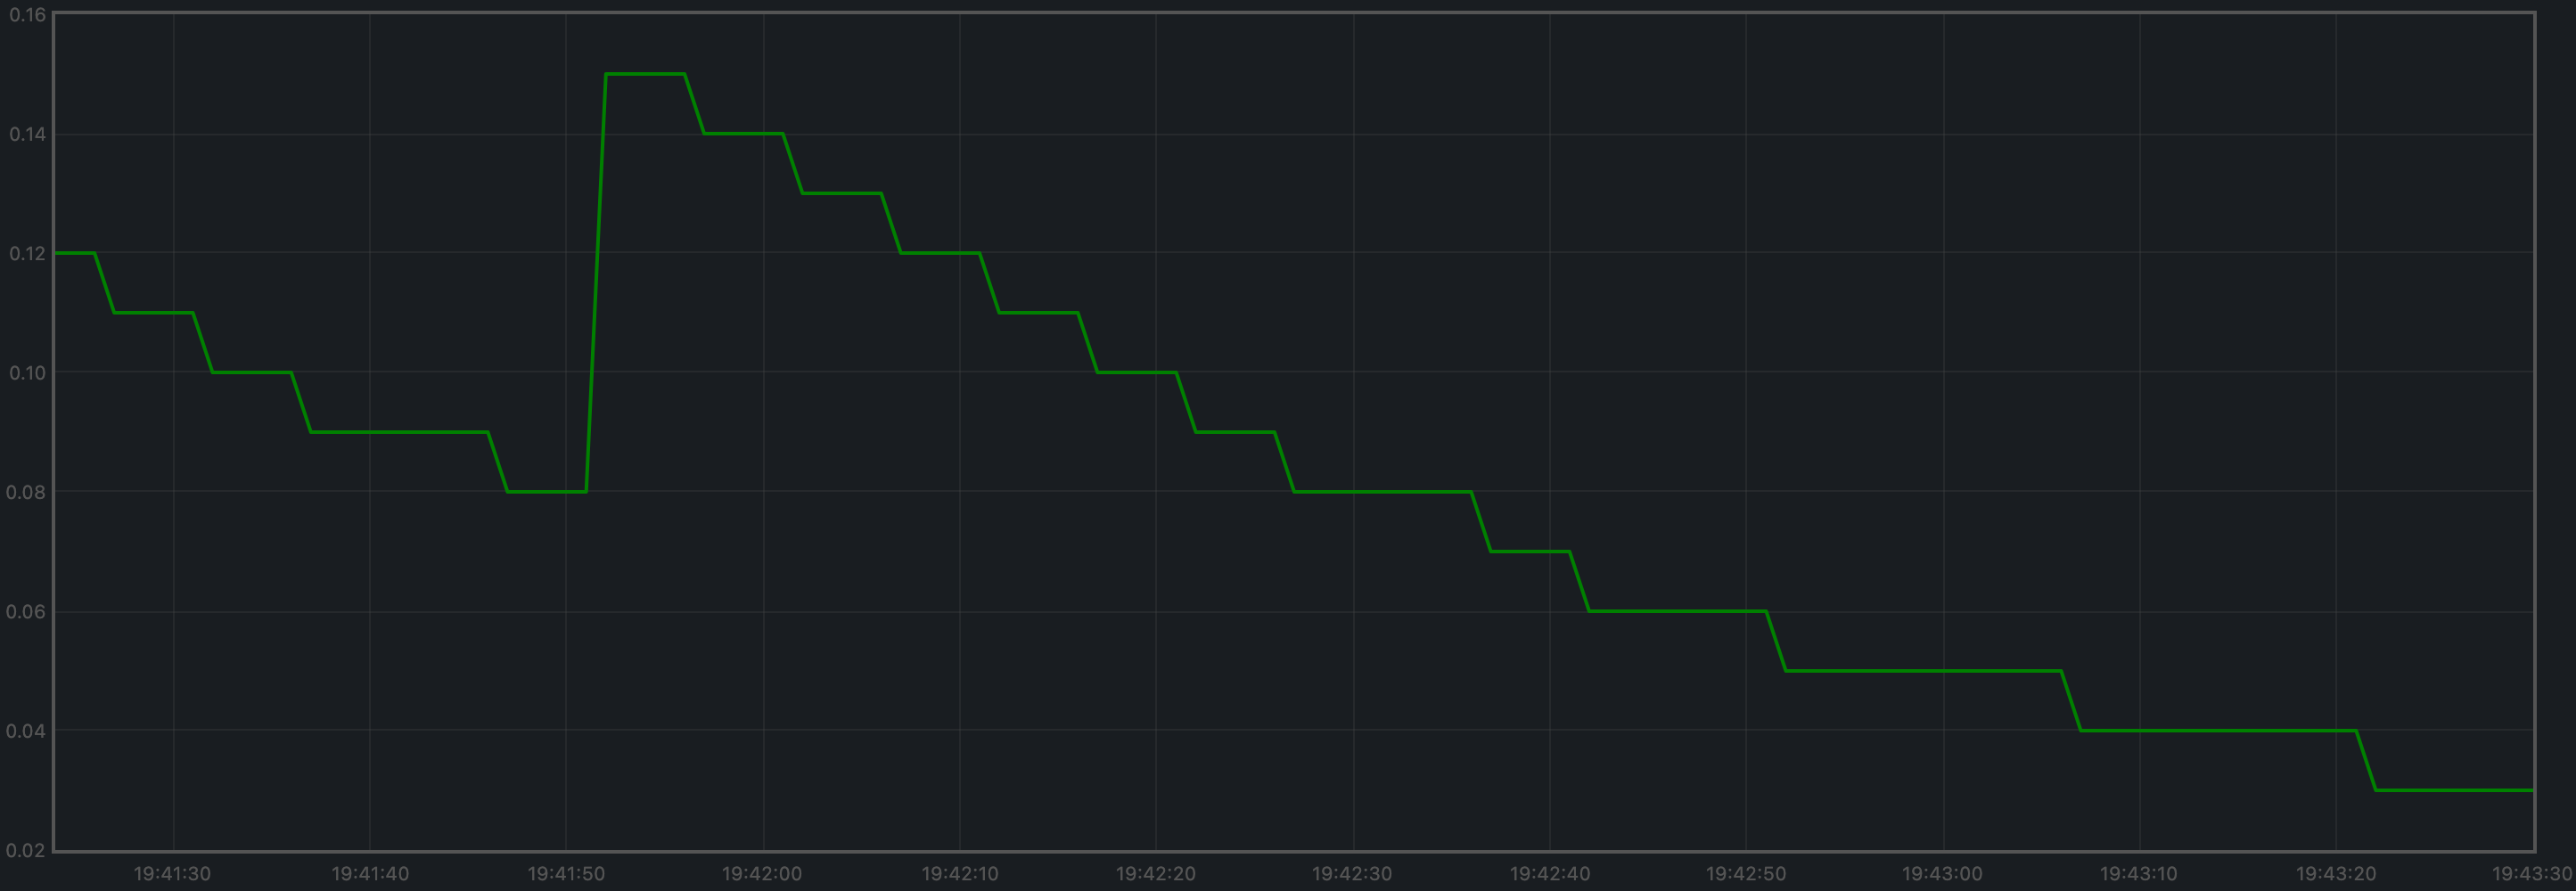
下图展示了在(r=200,c=2)条件下负载生成器的 CPU 负载(top 输出的 1 分钟平均值),
可以看到在大多数时间里负载都接近 0。
延迟分析
这里描述的方法使我们能够绘制所有实验中的交易延迟。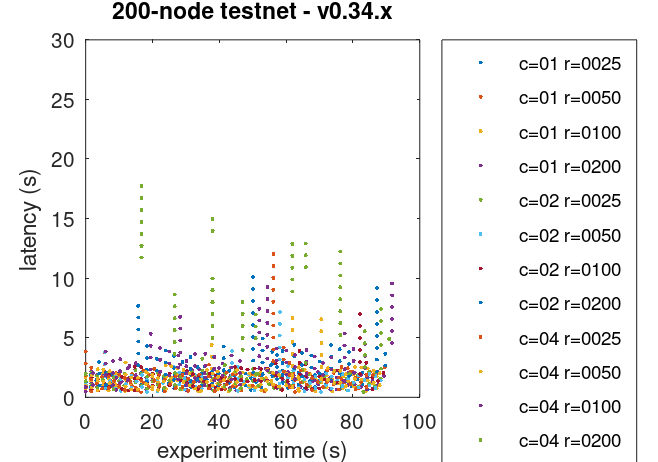 可以看到,即使是位于饱和对角线之外的实验,也仍然能够保持交易延迟稳定(即不会持续增长)。
我们的解释是,Tendermint Core 内部的争用通过
可以看到,即使是位于饱和对角线之外的实验,也仍然能够保持交易延迟稳定(即不会持续增长)。
我们的解释是,Tendermint Core 内部的争用通过 WebSocket 传播到了负载生成器;
因此,负载生成器无法产生目标负载,只能产生其中的一部分。
对 Prometheus 数据的进一步检查(见下文)表明,内存池在稳态下包含大量交易,
但其规模并未明显增长,而是会很快回到这一稳态。这表明
Tendermint Core 网络处理交易的速度至少与交易提交到 mempool 的速度一样快。
最后,测试脚本确保在实验结束时,mempool 为空,
从而保证所有提交到链上的交易都已被处理。
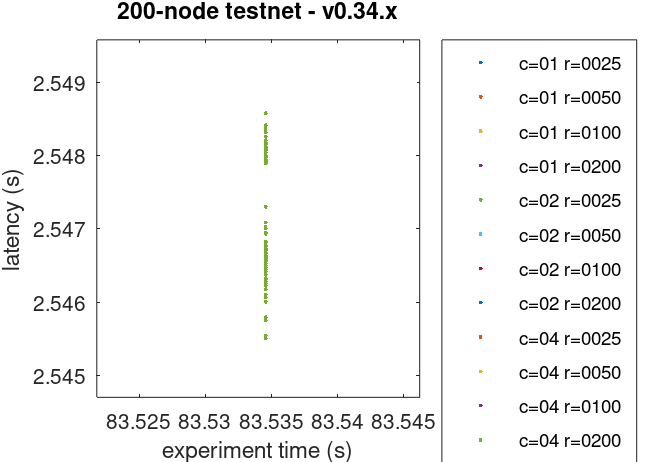
最后,图中的点数看起来明显少于预期,尤其是在接近或高于饱和对角线时,
而每个实验中的交易数量实际上更多。这是图形呈现带来的视觉效果;
图中看起来像单个点的对象,实际上可能是非常庞大的点簇。为佐证这一点,我们通过设置精心选择的极小坐标轴区间,对上图进行了放大。下方显示的点簇,在上图中看起来就像一个单点。
 该延迟图可作为与其他版本进行比较的基线。
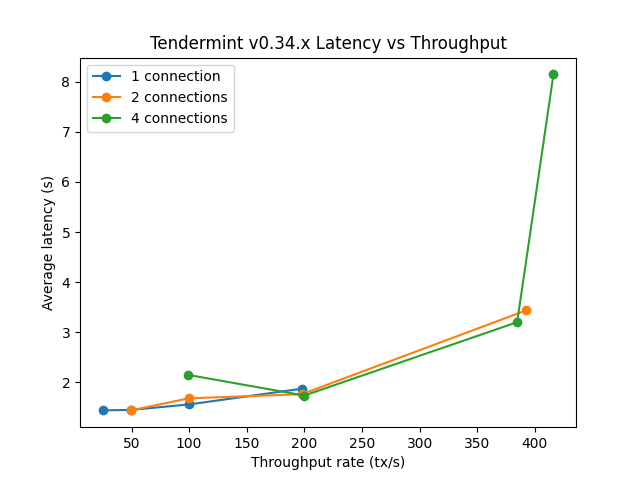
下图汇总了在不同
该延迟图可作为与其他版本进行比较的基线。
下图汇总了在不同 WebSocket 连接数下,向节点加载交易时的平均延迟与总体吞吐量之间的关系。
所选实验的 Prometheus 指标
如前文所述,所选实验为r=200,c=2。
本节进一步分析从 Prometheus 数据中提取的该实验关键指标。
内存池大小
内存池大小即 mempool 中交易数量的计数,在所有全节点上都表现为稳定且分布均匀。 它没有出现任何不受约束的增长。 下图展示了在某一时刻,所有全节点 mempool 中交易累计数量随时间的变化。 图中可见的两个尖峰,对应于某些节点上的共识实例推进到了初始轮次之后的阶段。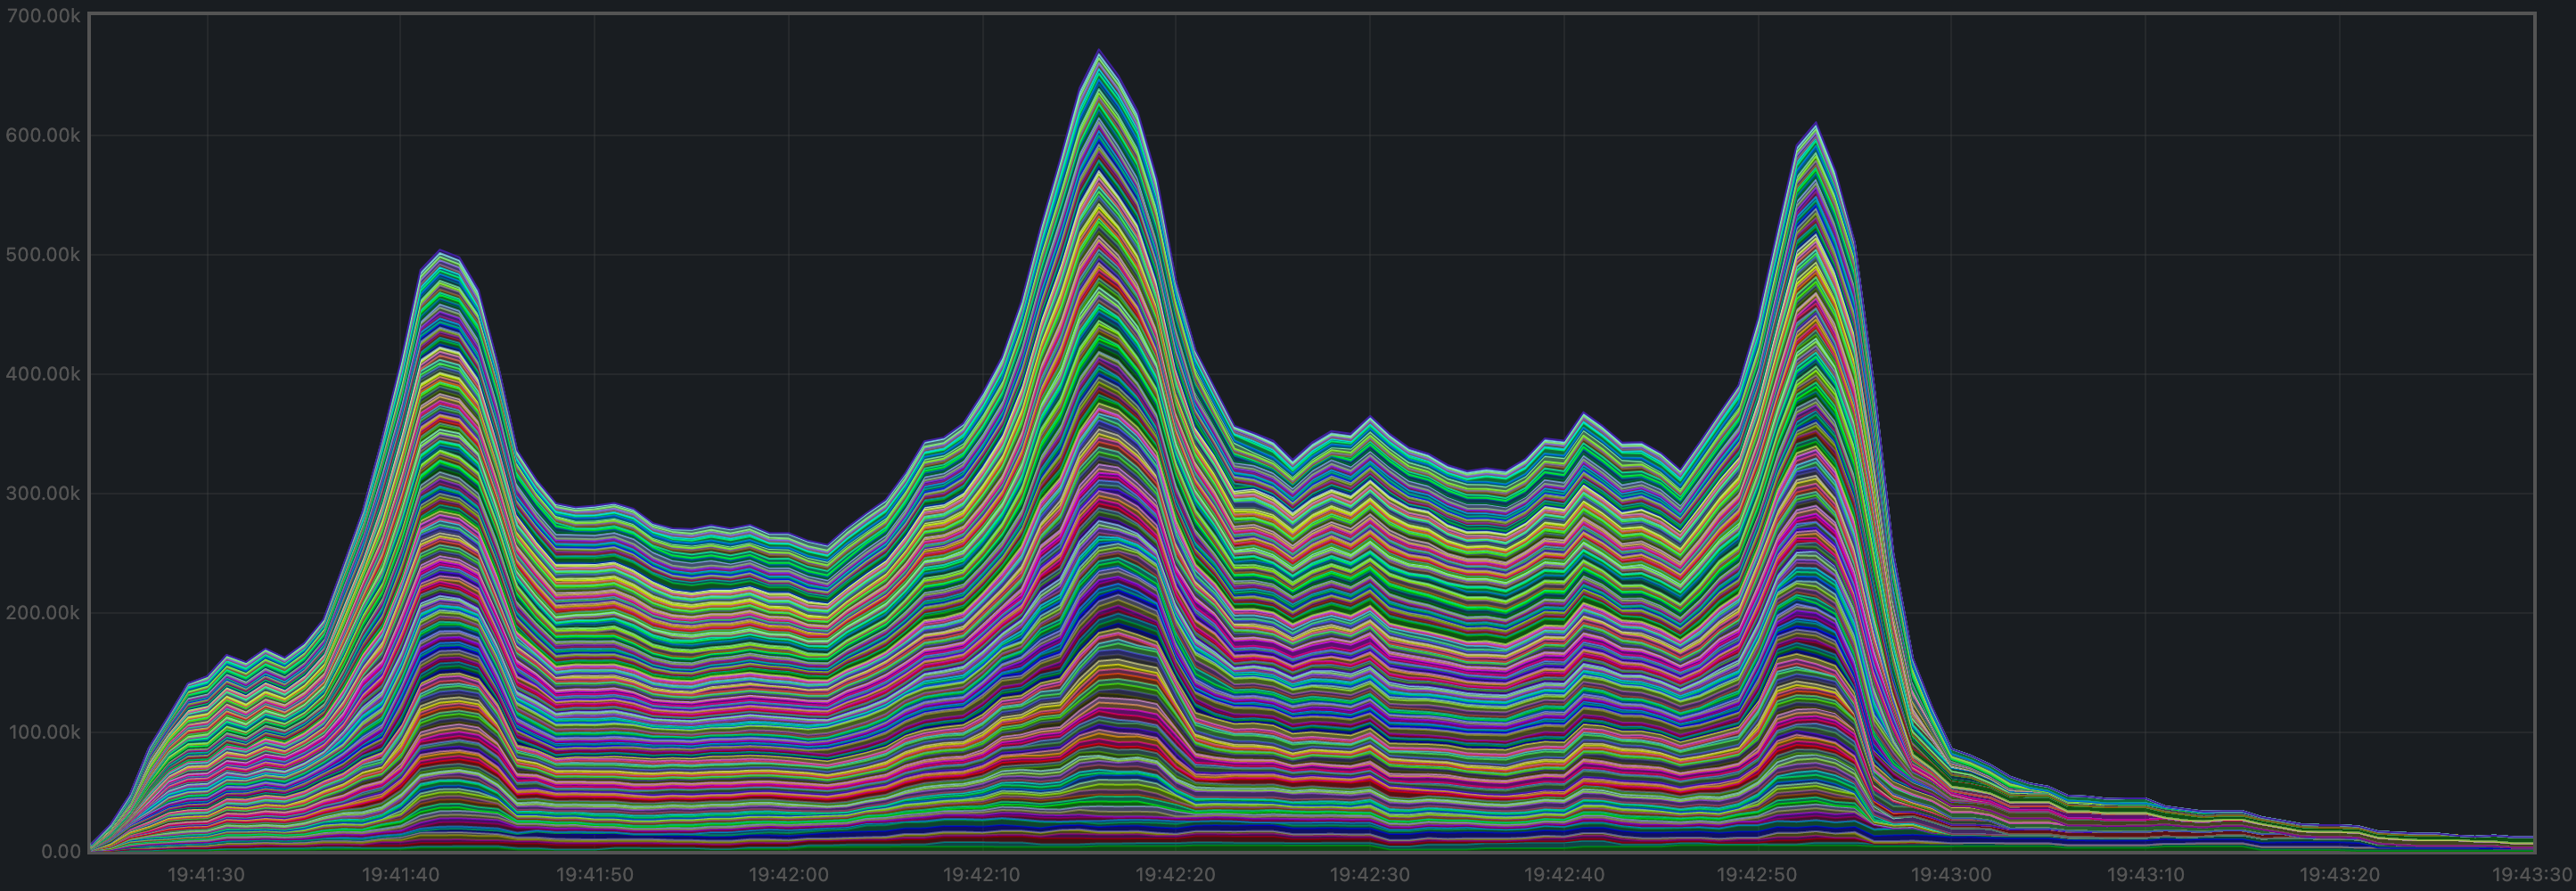 下图展示了所有全节点平均值随时间的变化,其未处理交易数在 1500 到 2000 之间波动。
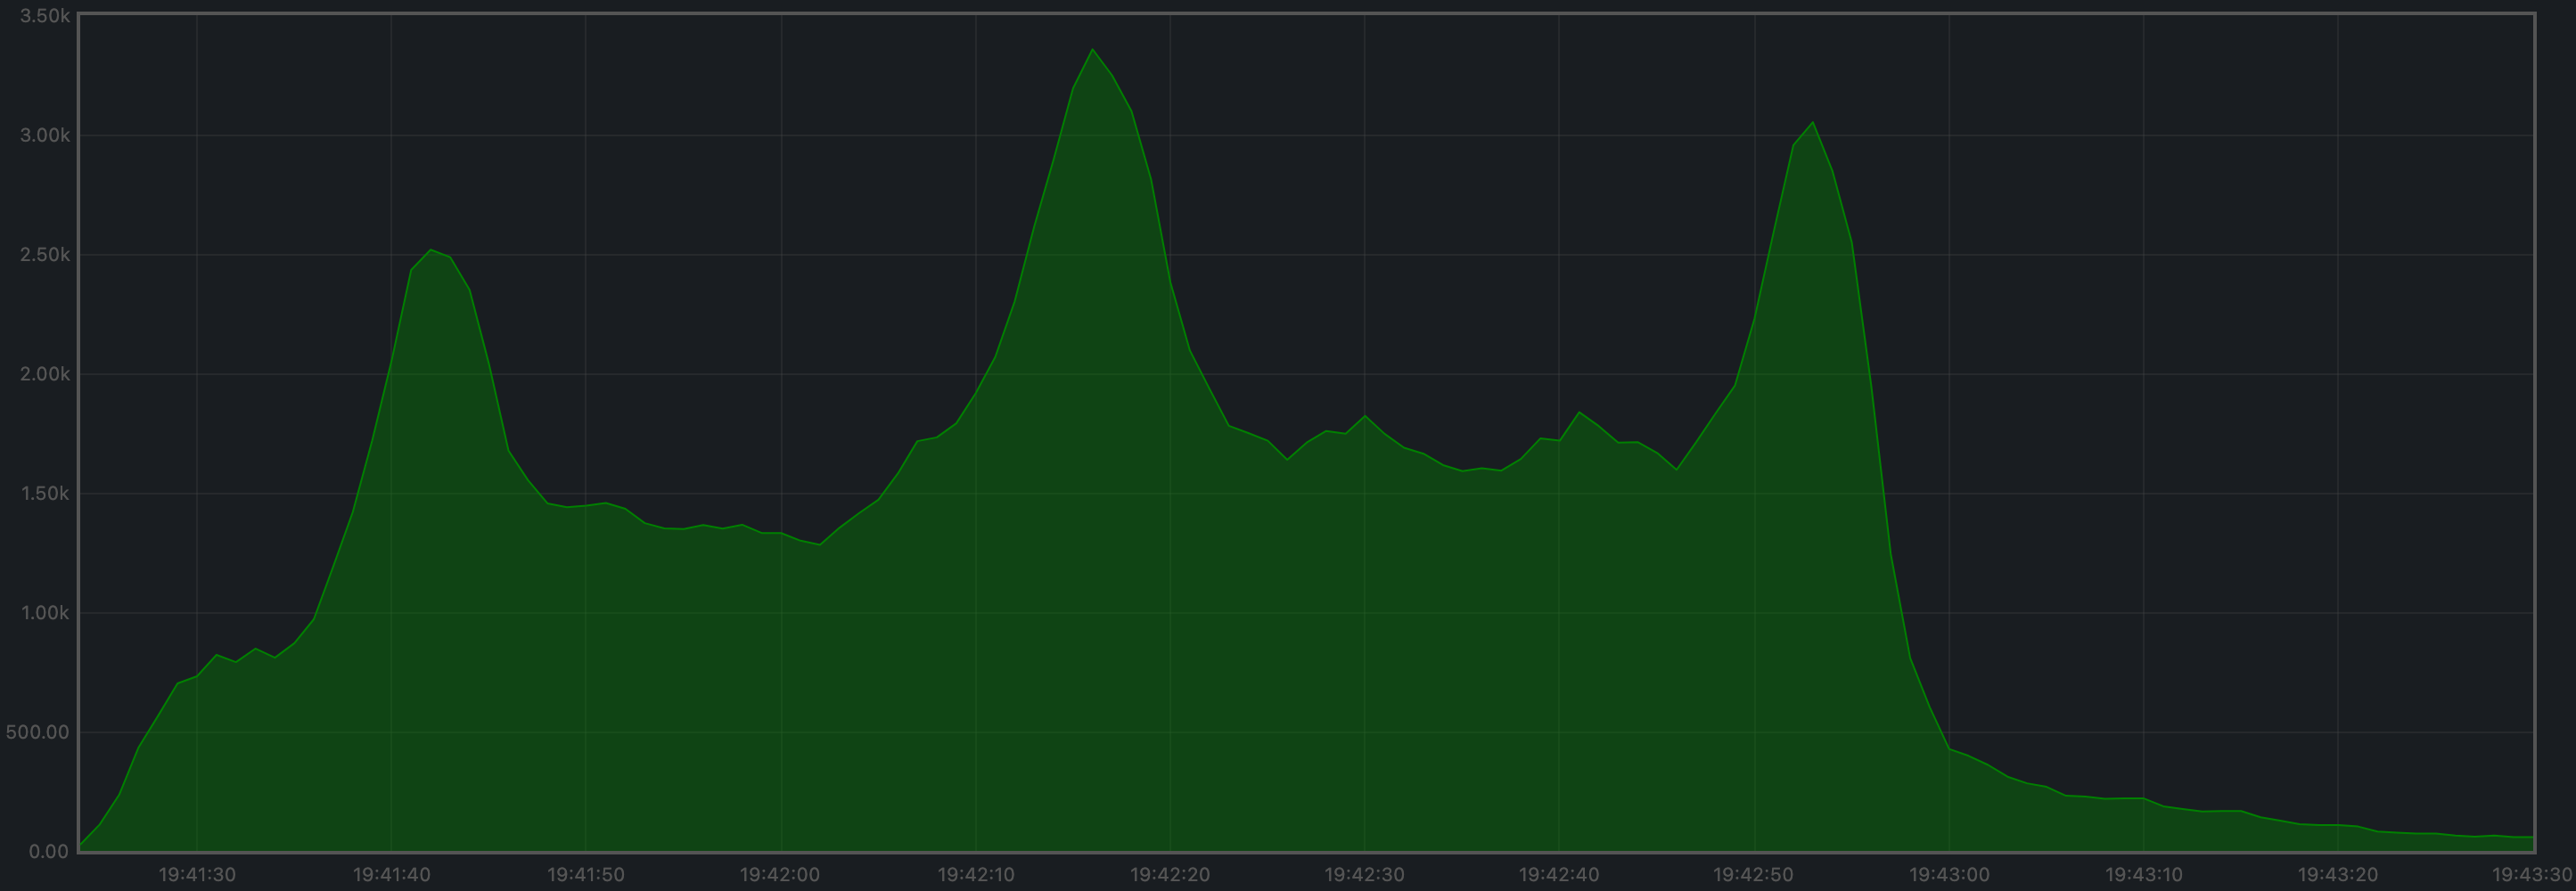 观察到的峰值与某些节点推进到初始共识轮次之后的时刻一致(见下文)。
对等节点
所有节点上的对等节点数量都很稳定。 种子节点的数量更高(约 140),其余节点则在 21 到 74 之间。 非种子节点之所以会超过 50 个对等节点,是由于 #9548。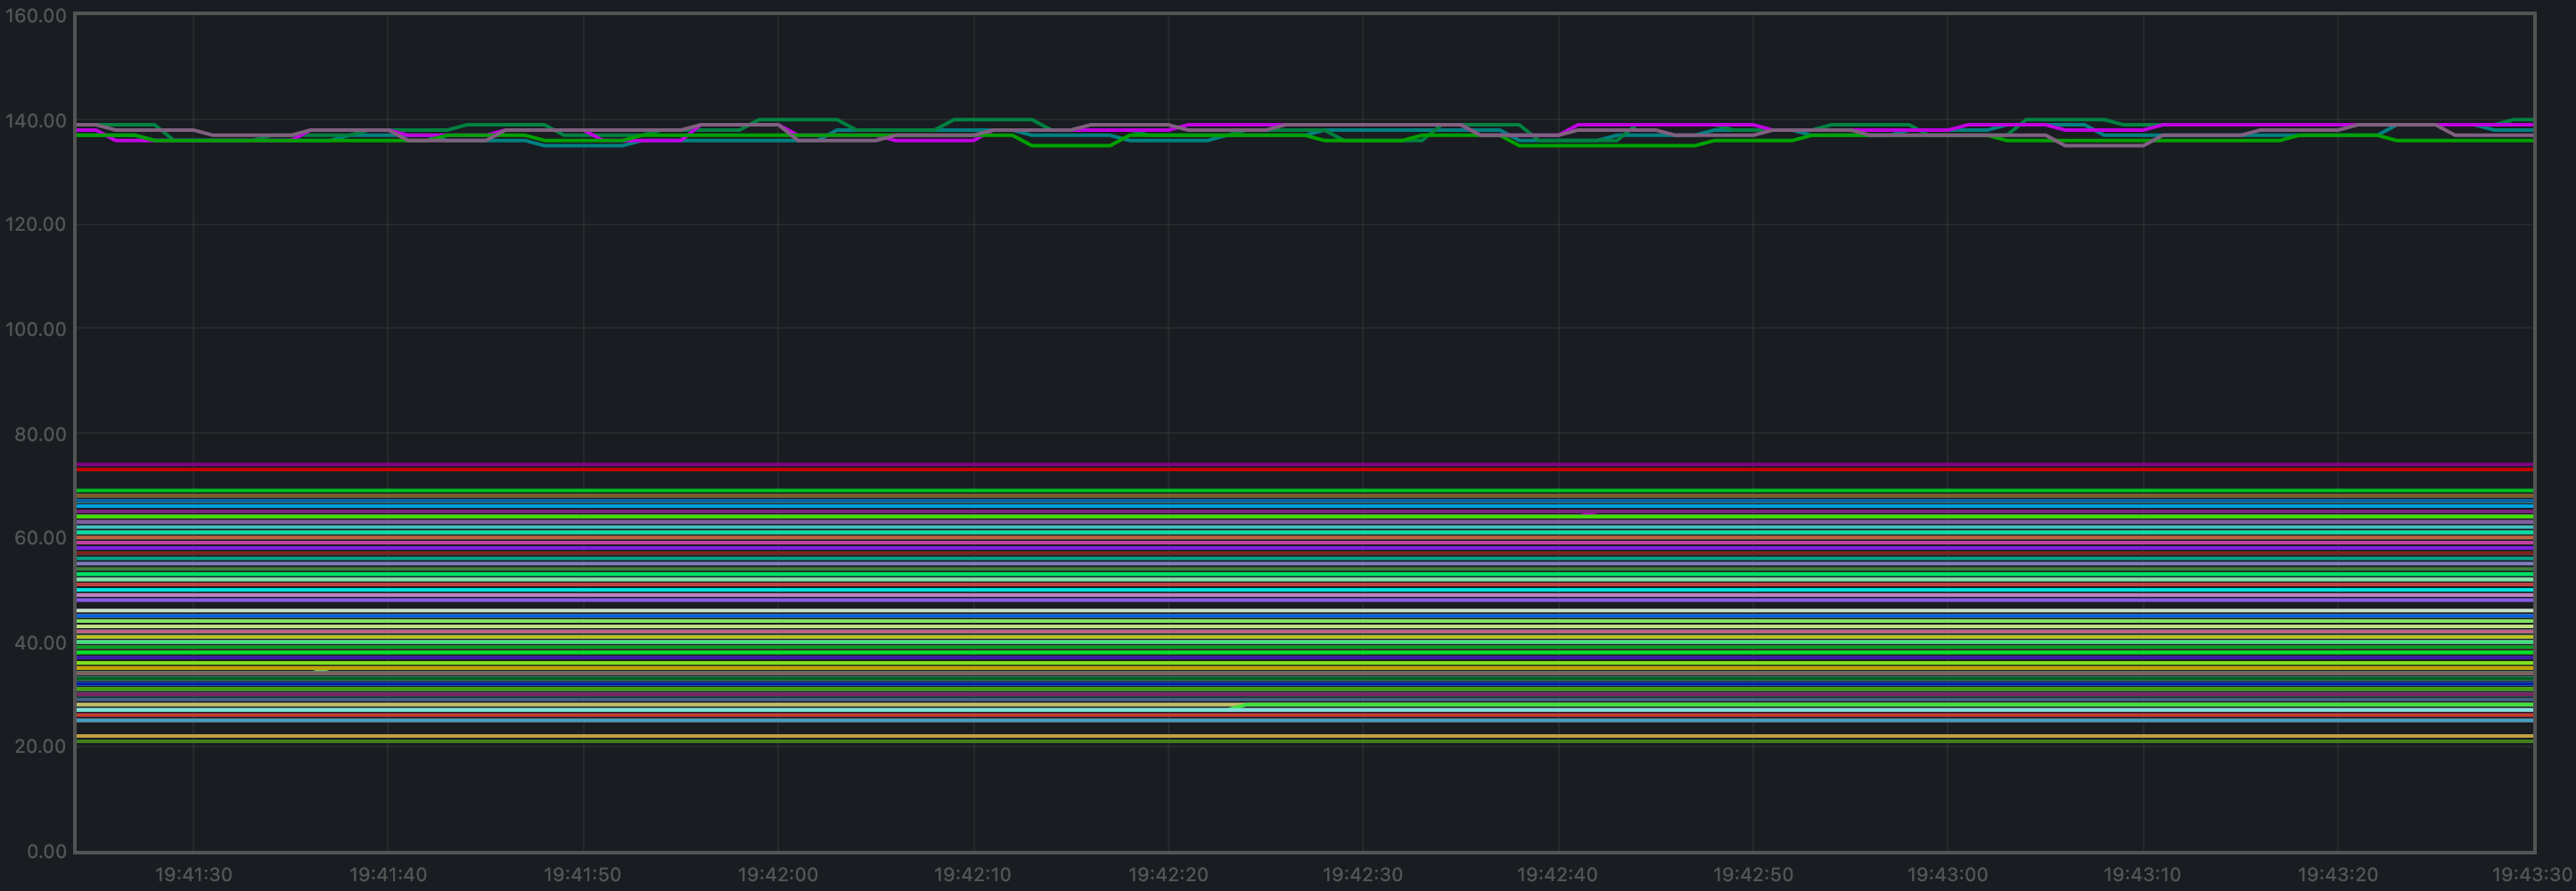
每个高度的共识轮次
大多数节点在大多数高度上只使用第 0 轮,但某些节点在部分高度上需要推进到第 1 轮。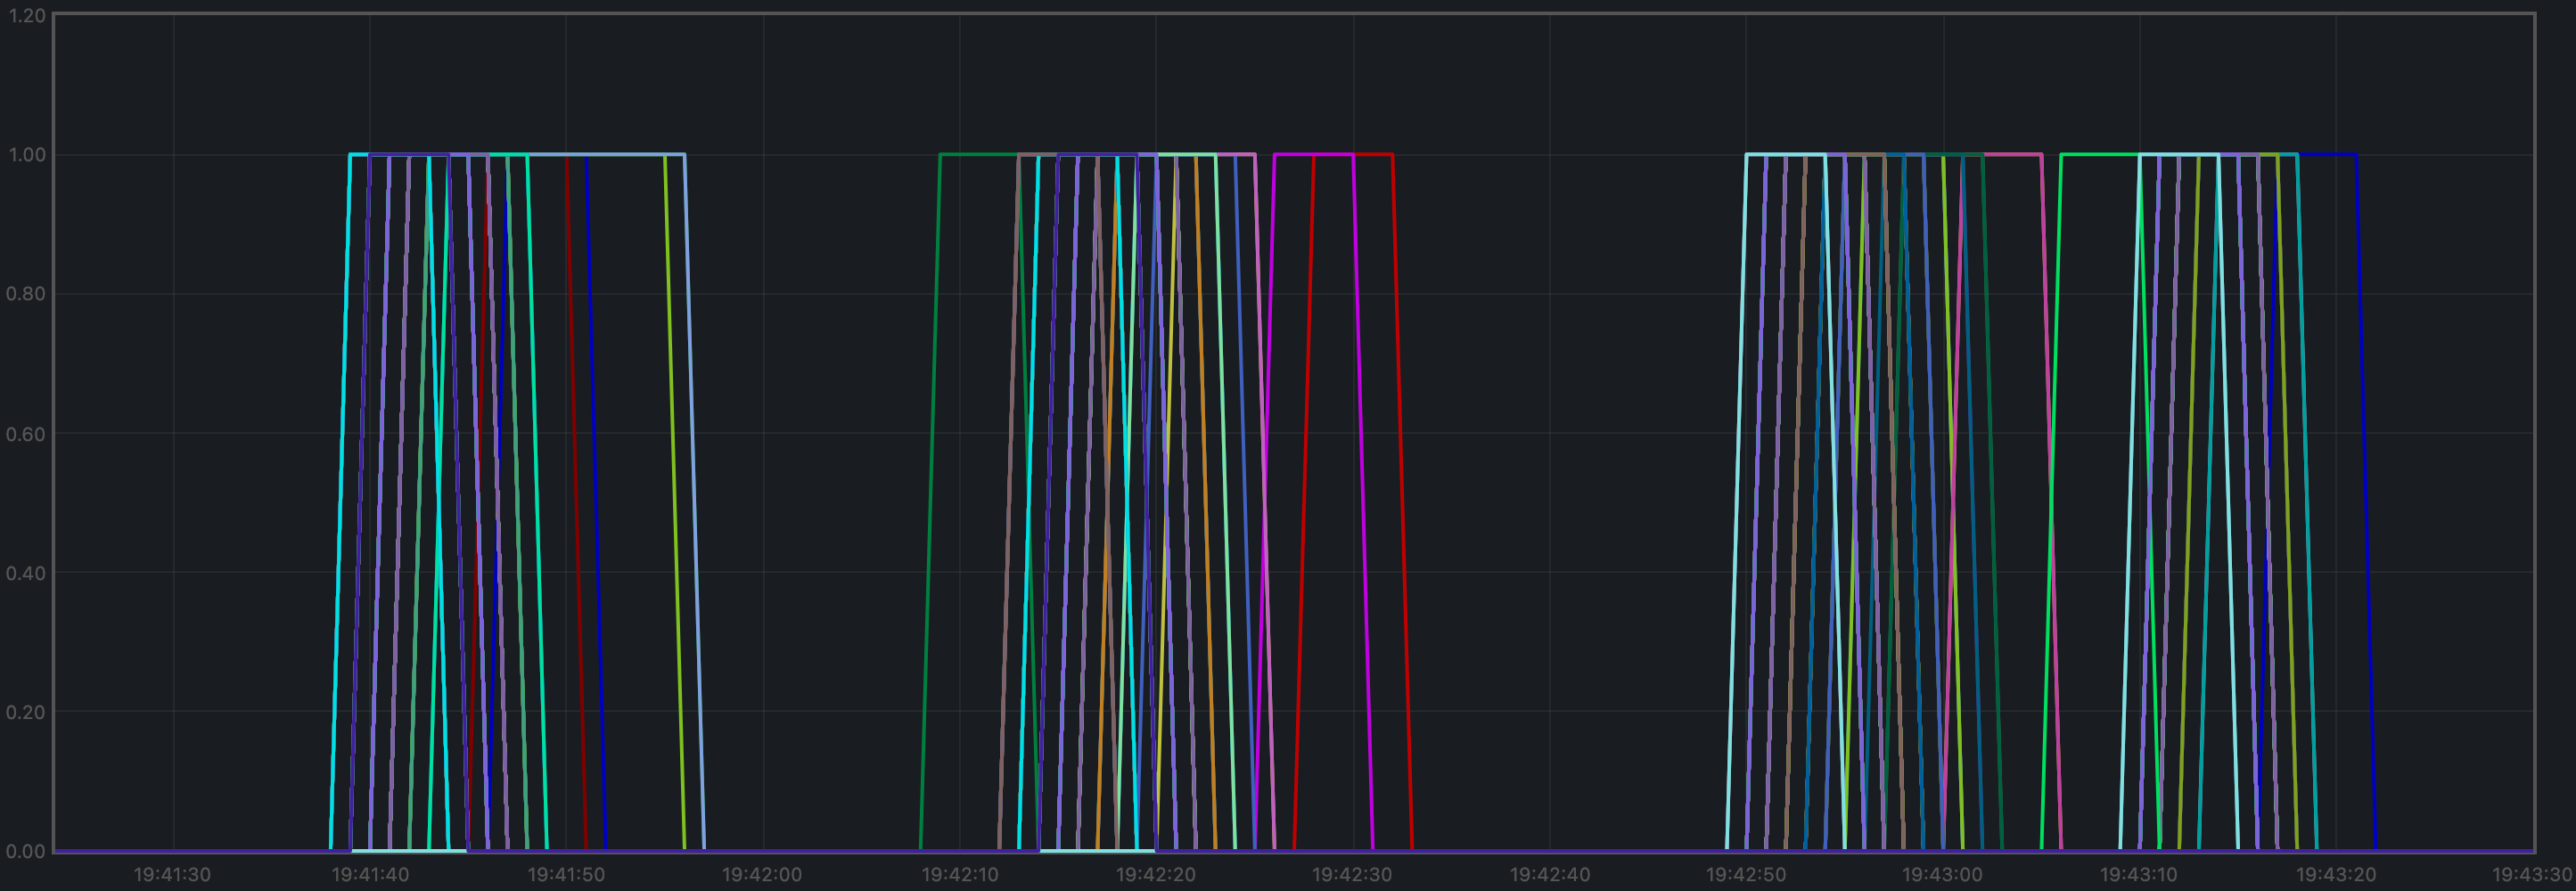
每分钟产生的区块数、每分钟处理的交易数
每分钟产生的区块数就是下图曲线的斜率。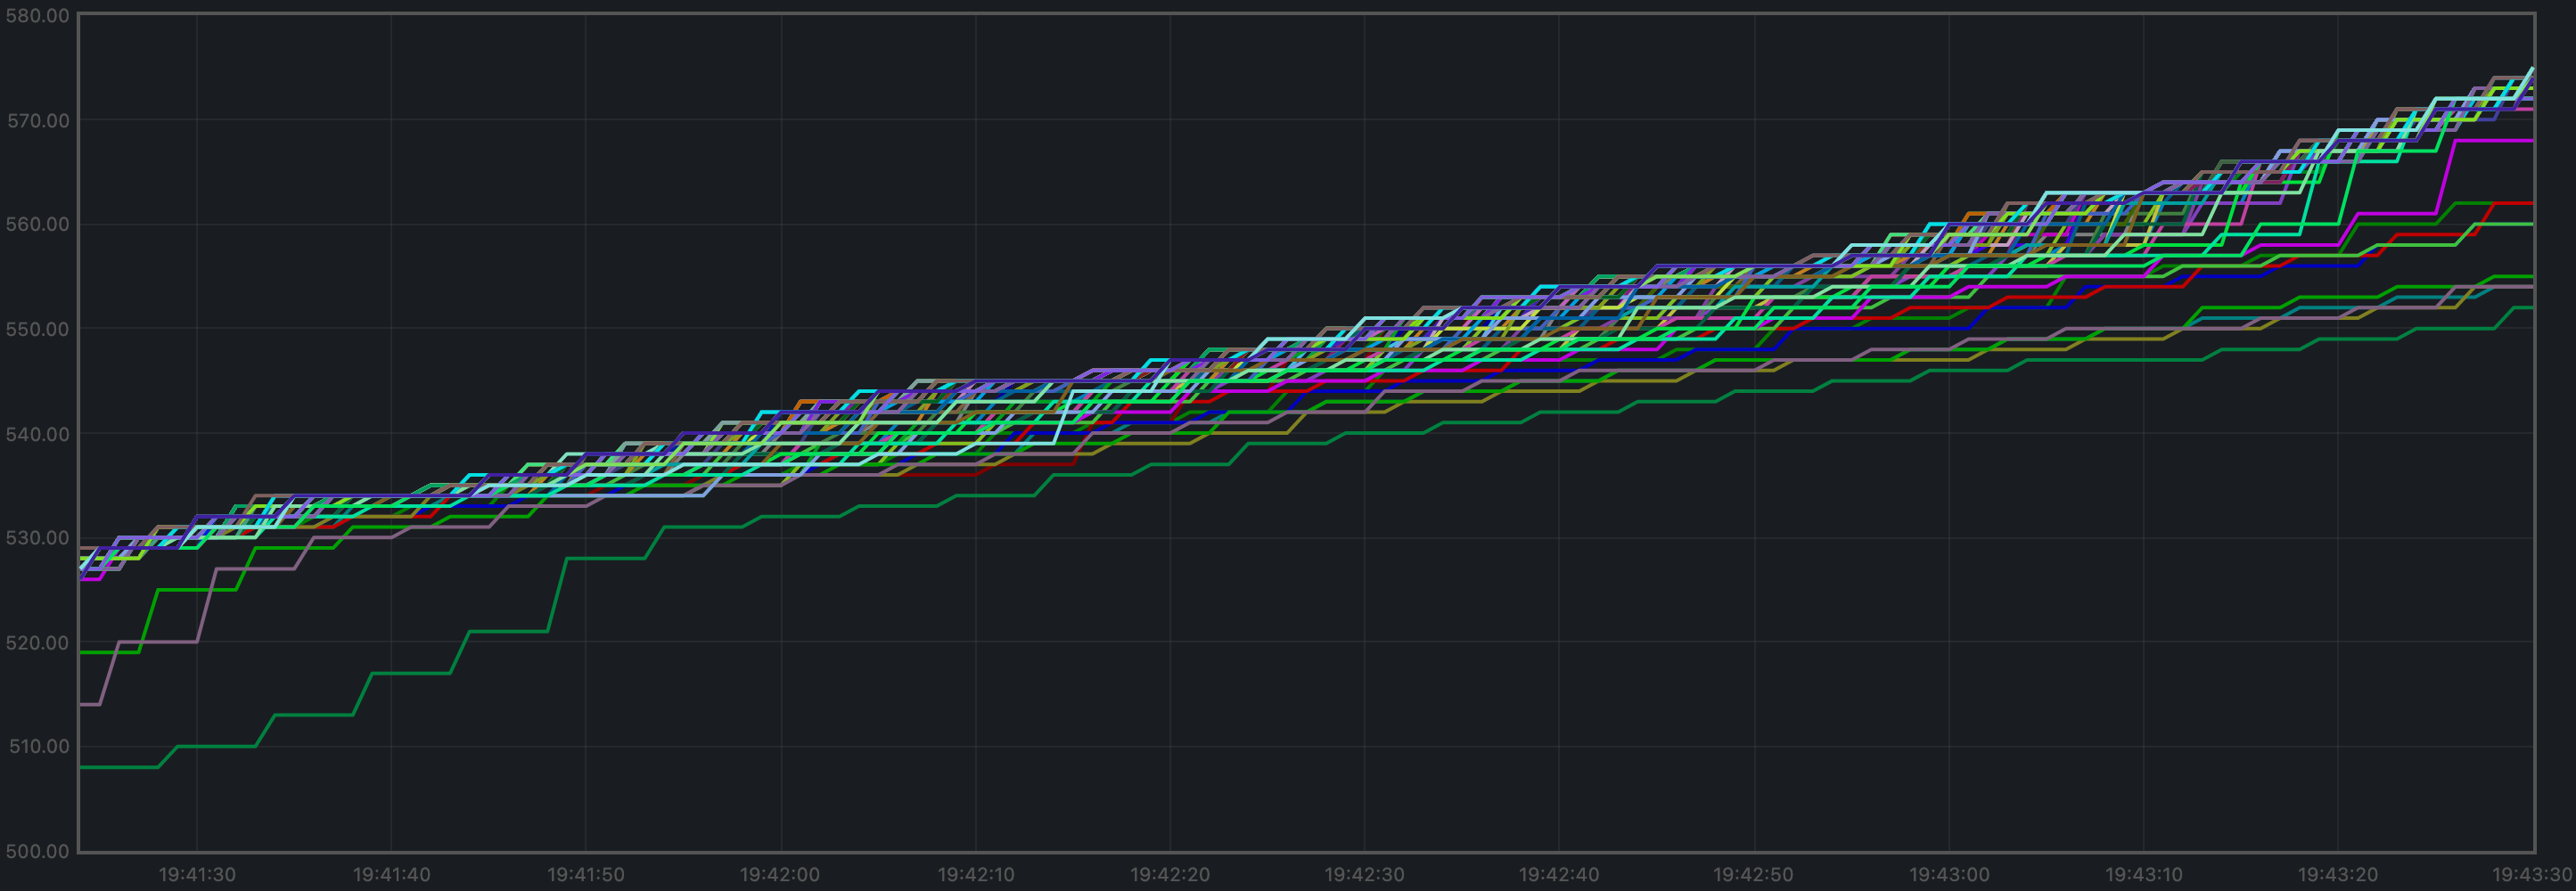 在 2 分钟内,高度从 530 增长到 569。
由此得出平均每分钟产生 19.5 个区块。
每分钟处理的交易数就是下图曲线的斜率。
在 2 分钟内,高度从 530 增长到 569。
由此得出平均每分钟产生 19.5 个区块。
每分钟处理的交易数就是下图曲线的斜率。
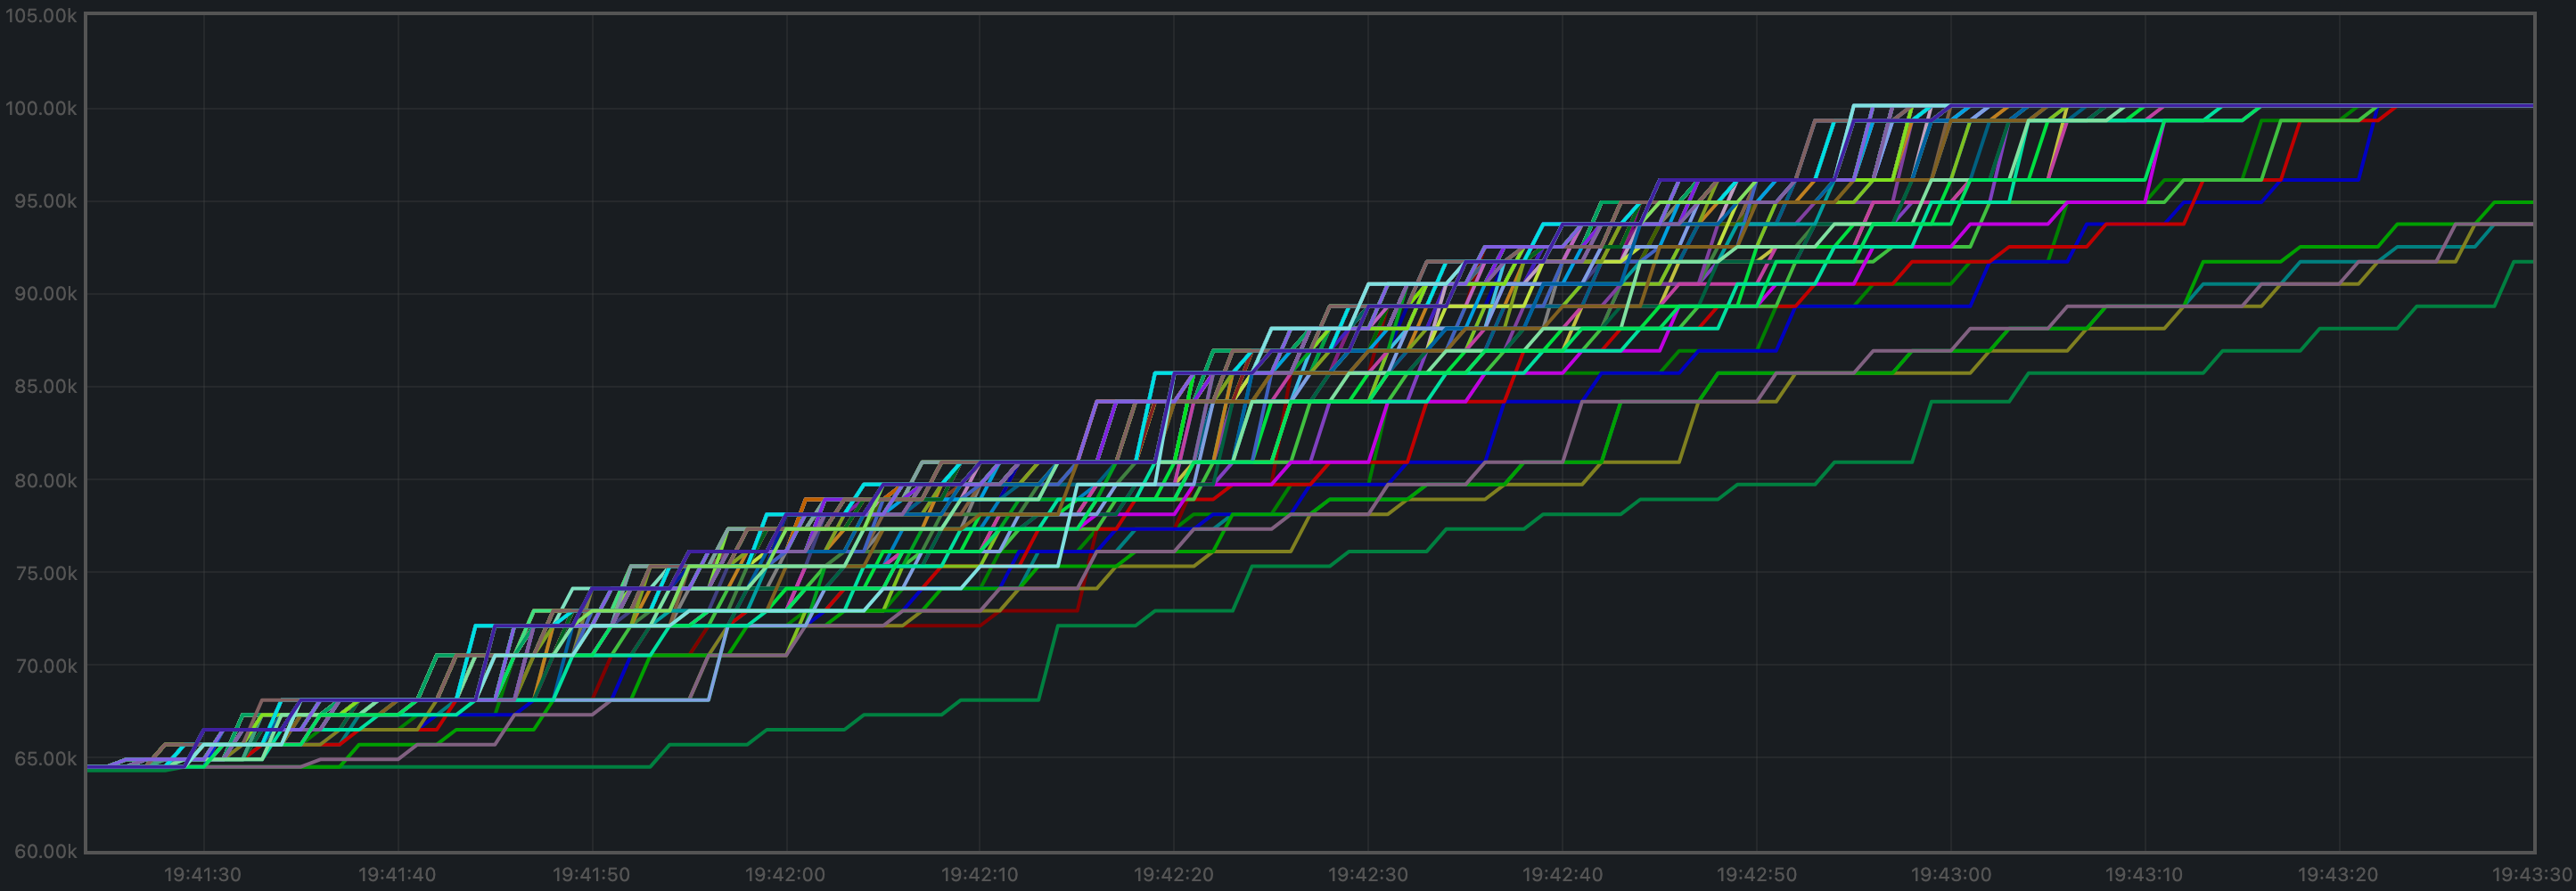 在 2 分钟内,总数从 64525 增长到 100125 笔交易,
结果为每分钟 17800 笔交易。不过,从图中可以看到,
负载中的所有交易在这两分钟结束之前很久就已经处理完成。
如果我们根据交易实际被处理的时间窗口(约 105 秒)进行调整,
则得到每分钟 20343 笔交易。
在 2 分钟内,总数从 64525 增长到 100125 笔交易,
结果为每分钟 17800 笔交易。不过,从图中可以看到,
负载中的所有交易在这两分钟结束之前很久就已经处理完成。
如果我们根据交易实际被处理的时间窗口(约 105 秒)进行调整,
则得到每分钟 20343 笔交易。
常驻内存集大小
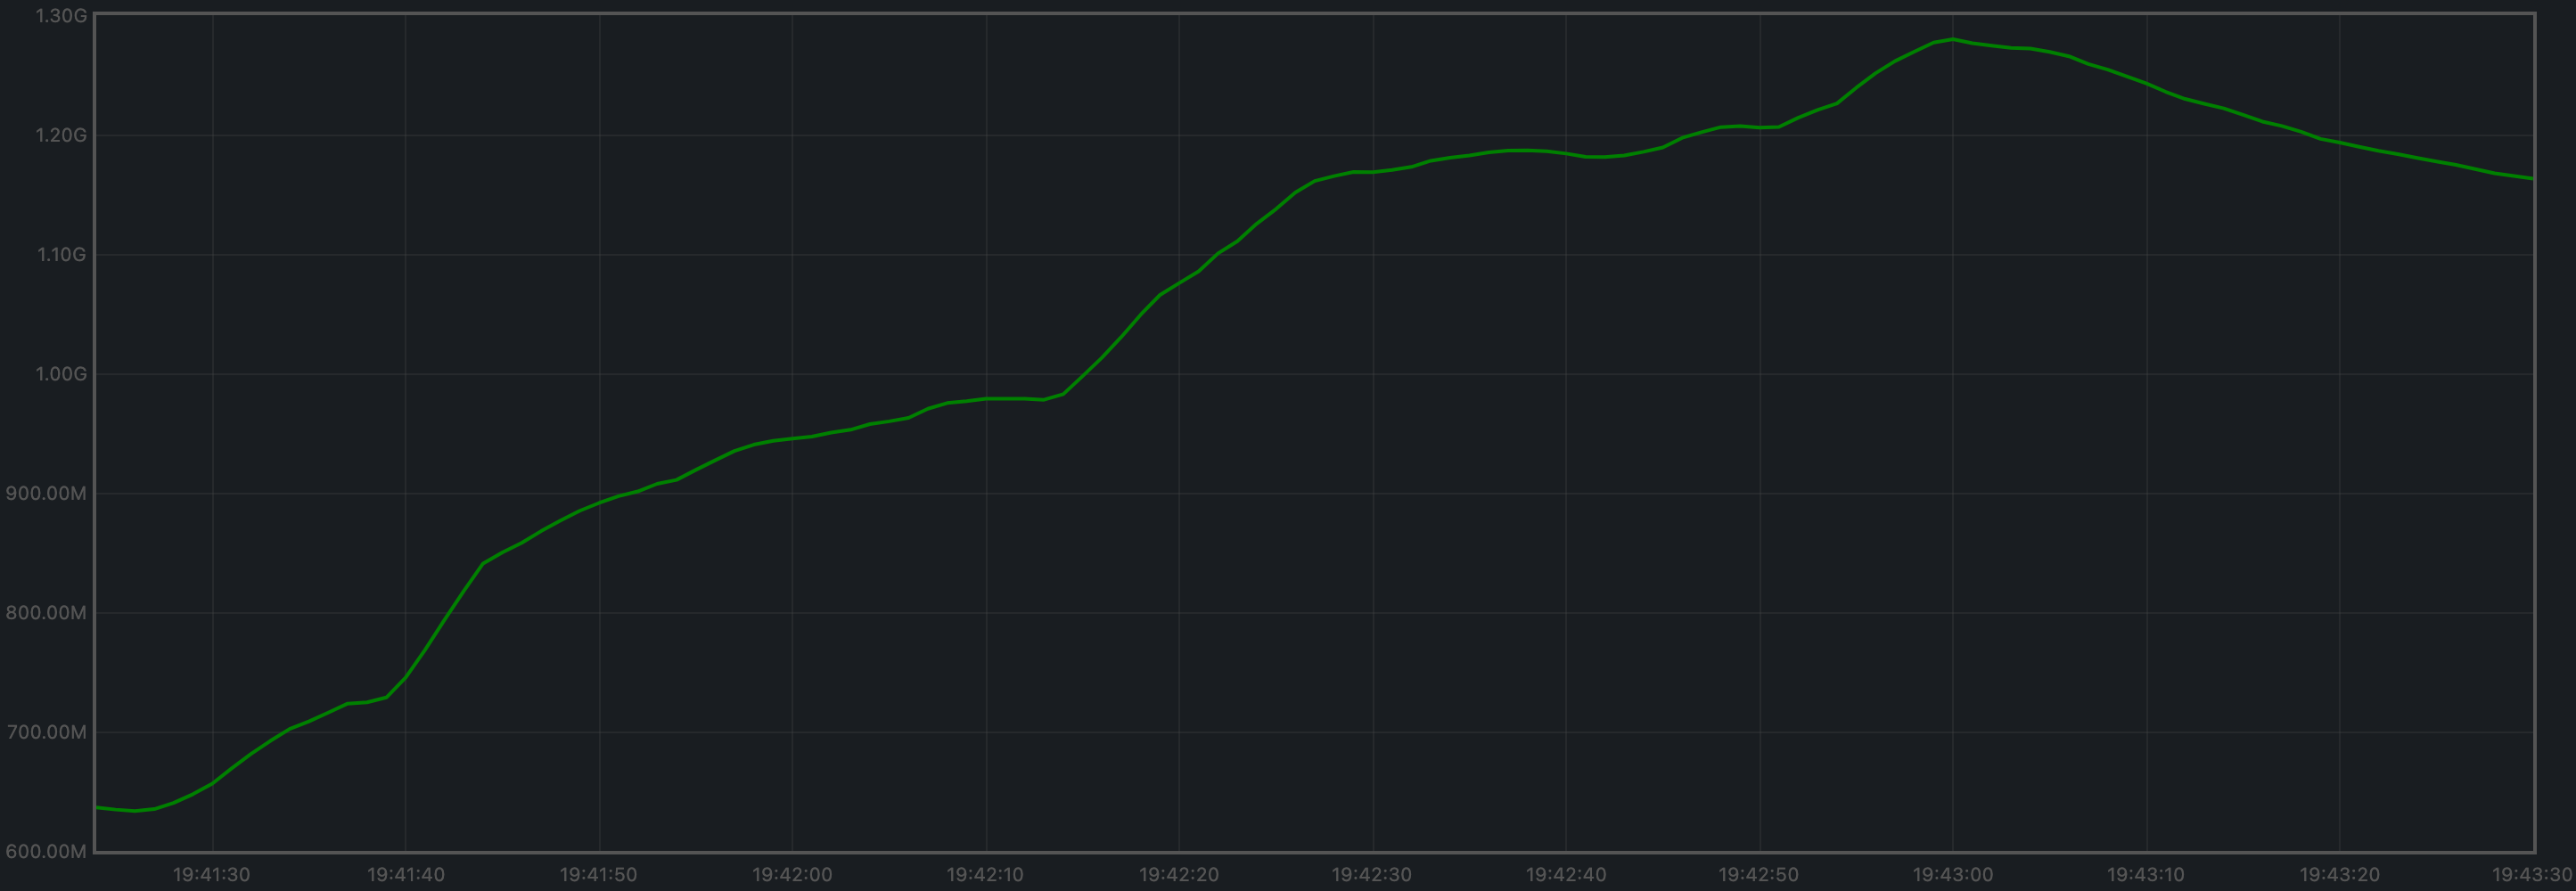
下图绘制了所有被监控进程的常驻内存集大小(RSS)。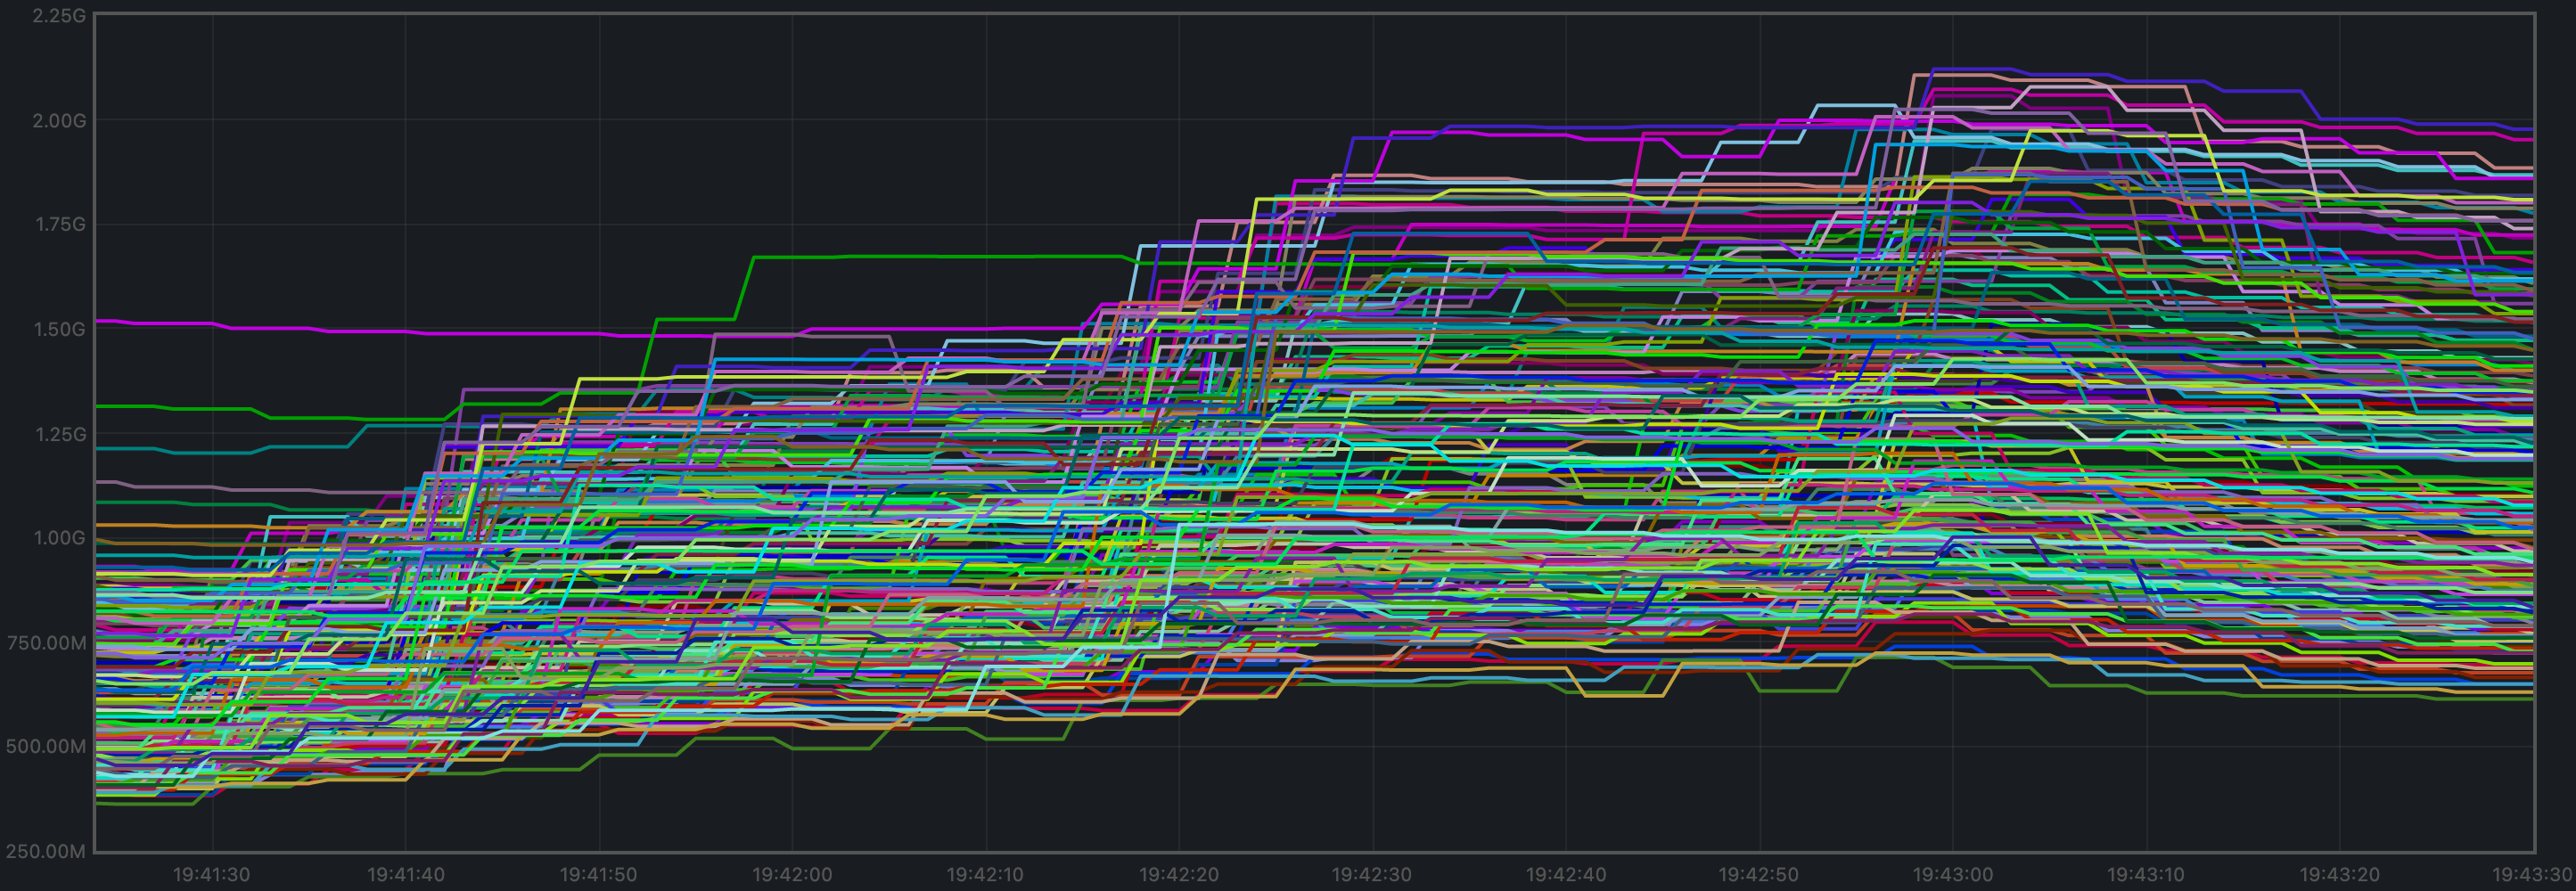 所有进程的平均值在 1.2 GiB 左右波动,未显示出不受约束的增长。
CPU 利用率
在 Unix 机器上,从 Prometheus 角度衡量 CPU 利用率的最佳指标是load1,因为它通常会出现在
top 的输出中。
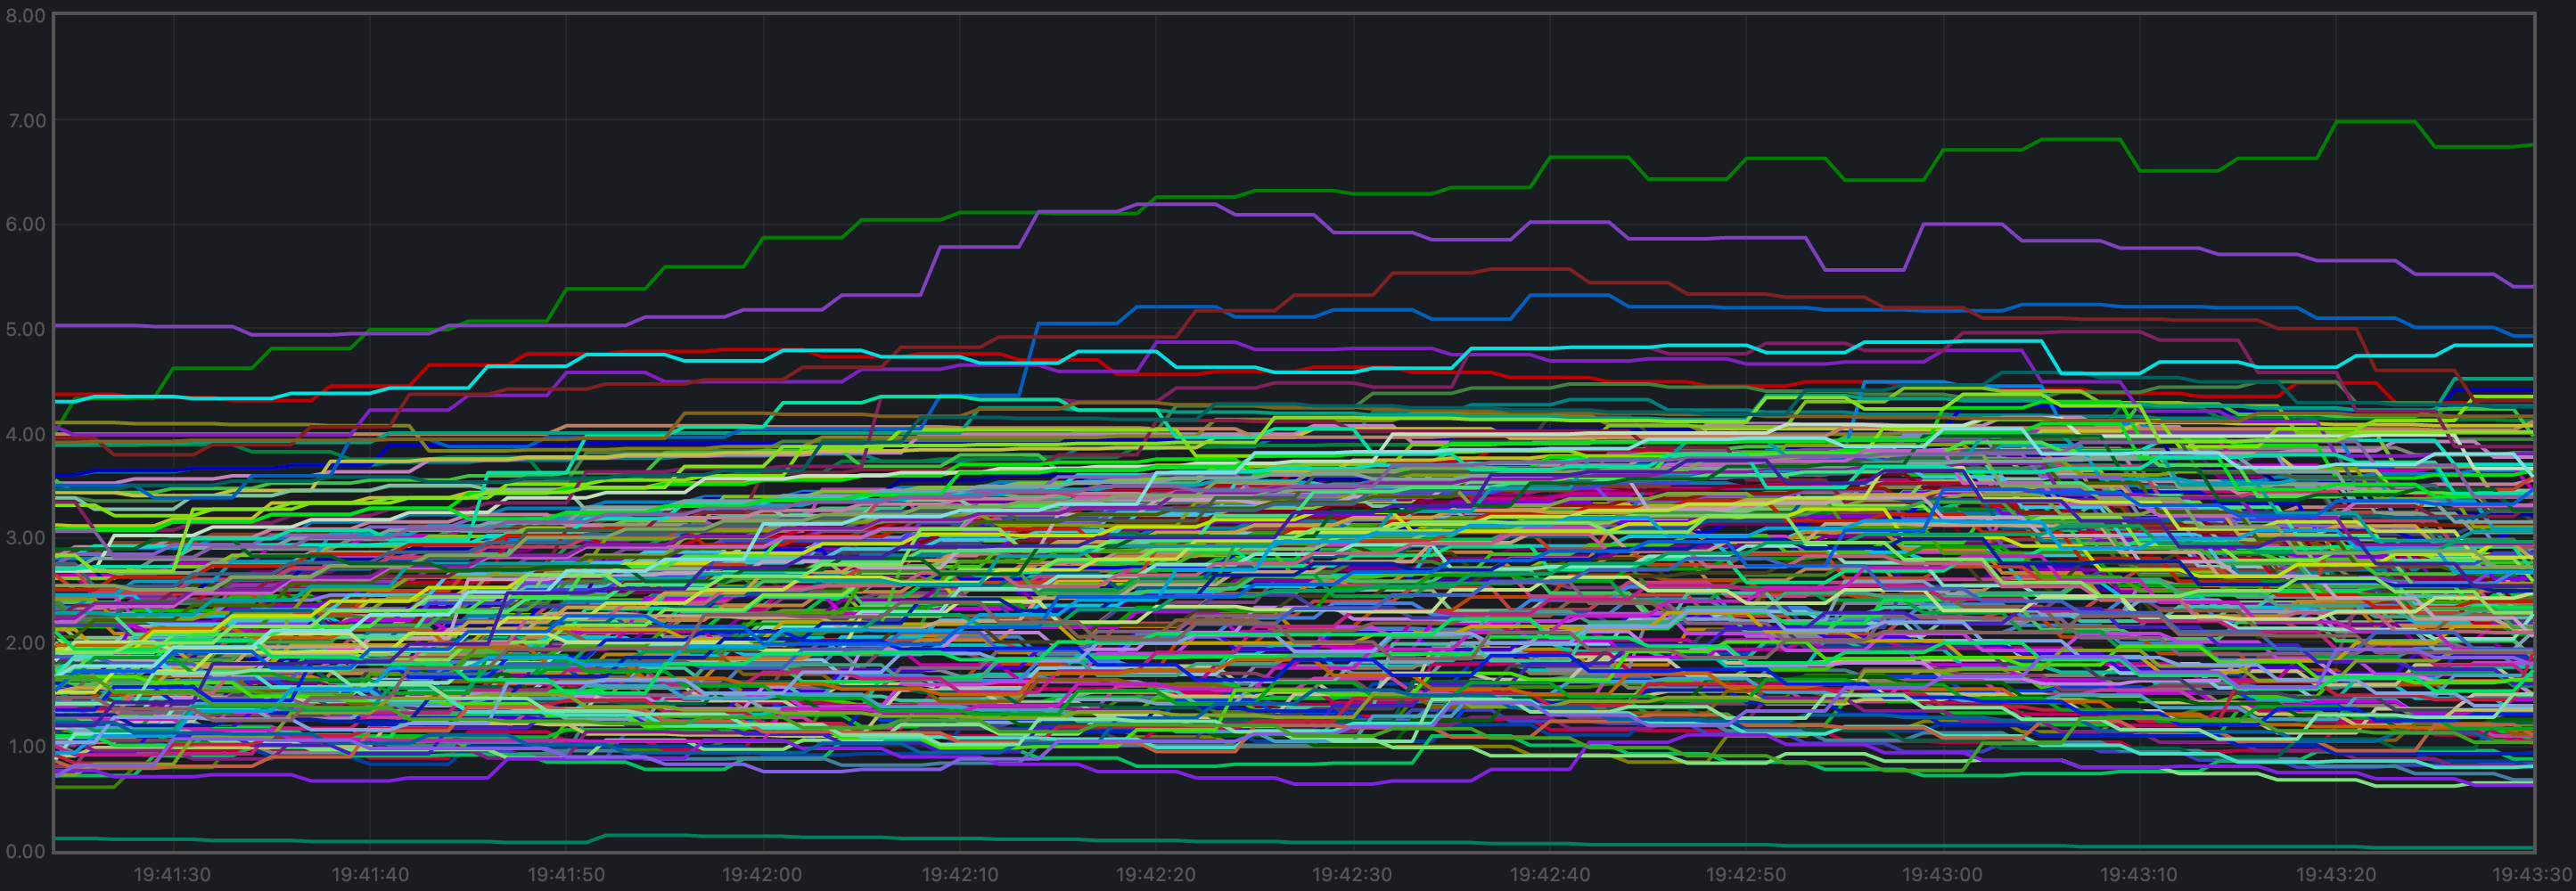 在大多数情况下,它都低于 5,这通常被认为是可接受的负载水平。
测试结果
结果:N/A(v0.34.x 是基线) 日期:2022-10-14 版本:3ec6e424d6ae4c96867c2dcf8310572156068bb6轮换节点测试网
对于该测试网,我们将使用一个可以安全地视为低于其饱和点的负载 (该测试网规模在 13 到 38 个全节点之间):c=4,r=800。
注:用于这些测试的 CometBFT 版本受 #9539 影响。
不过,到达 mempool 的负载减少这一点,与我们此处关注的功能是正交的。
延迟
所有延迟的图表如下所示。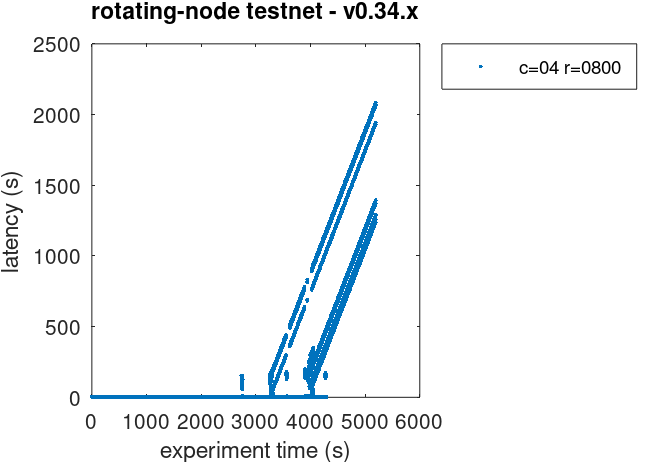 可以观察到,在测试后期出现了一些非常高的延迟。
怀疑它们是重复交易后,我们检查了延迟原始文件,
并发现存在超过 10 万笔重复交易。
下图展示了移除了所有重复交易后的延迟文件,
也就是说,对于重复交易只保留其首次出现。
可以观察到,在测试后期出现了一些非常高的延迟。
怀疑它们是重复交易后,我们检查了延迟原始文件,
并发现存在超过 10 万笔重复交易。
下图展示了移除了所有重复交易后的延迟文件,
也就是说,对于重复交易只保留其首次出现。
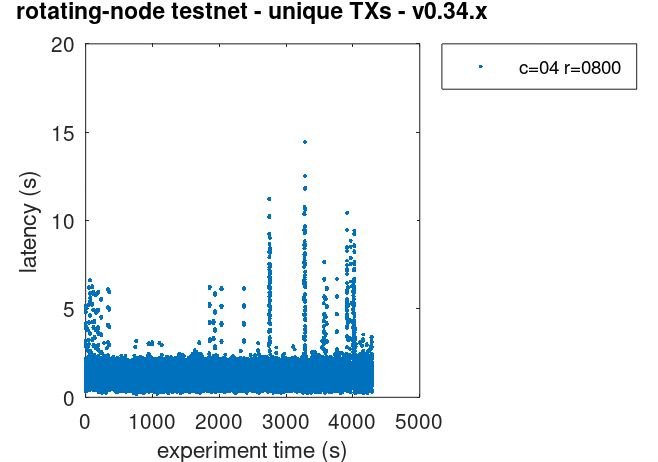 这个存在于
这个存在于 v0.34.x 中的问题需要被解决,也许可以采用与我们在高负载下运行 200 节点测试时相同的方法:增大 cache_size 配置参数。
Prometheus 指标
这里展示的指标集合比 200 节点实验更少。 我们只关注那些可能受到追赶过程(blocksync)影响的指标。每分钟区块数与交易数
与 200 节点测试中展示的一样,每分钟产生的区块数是下图的梯度。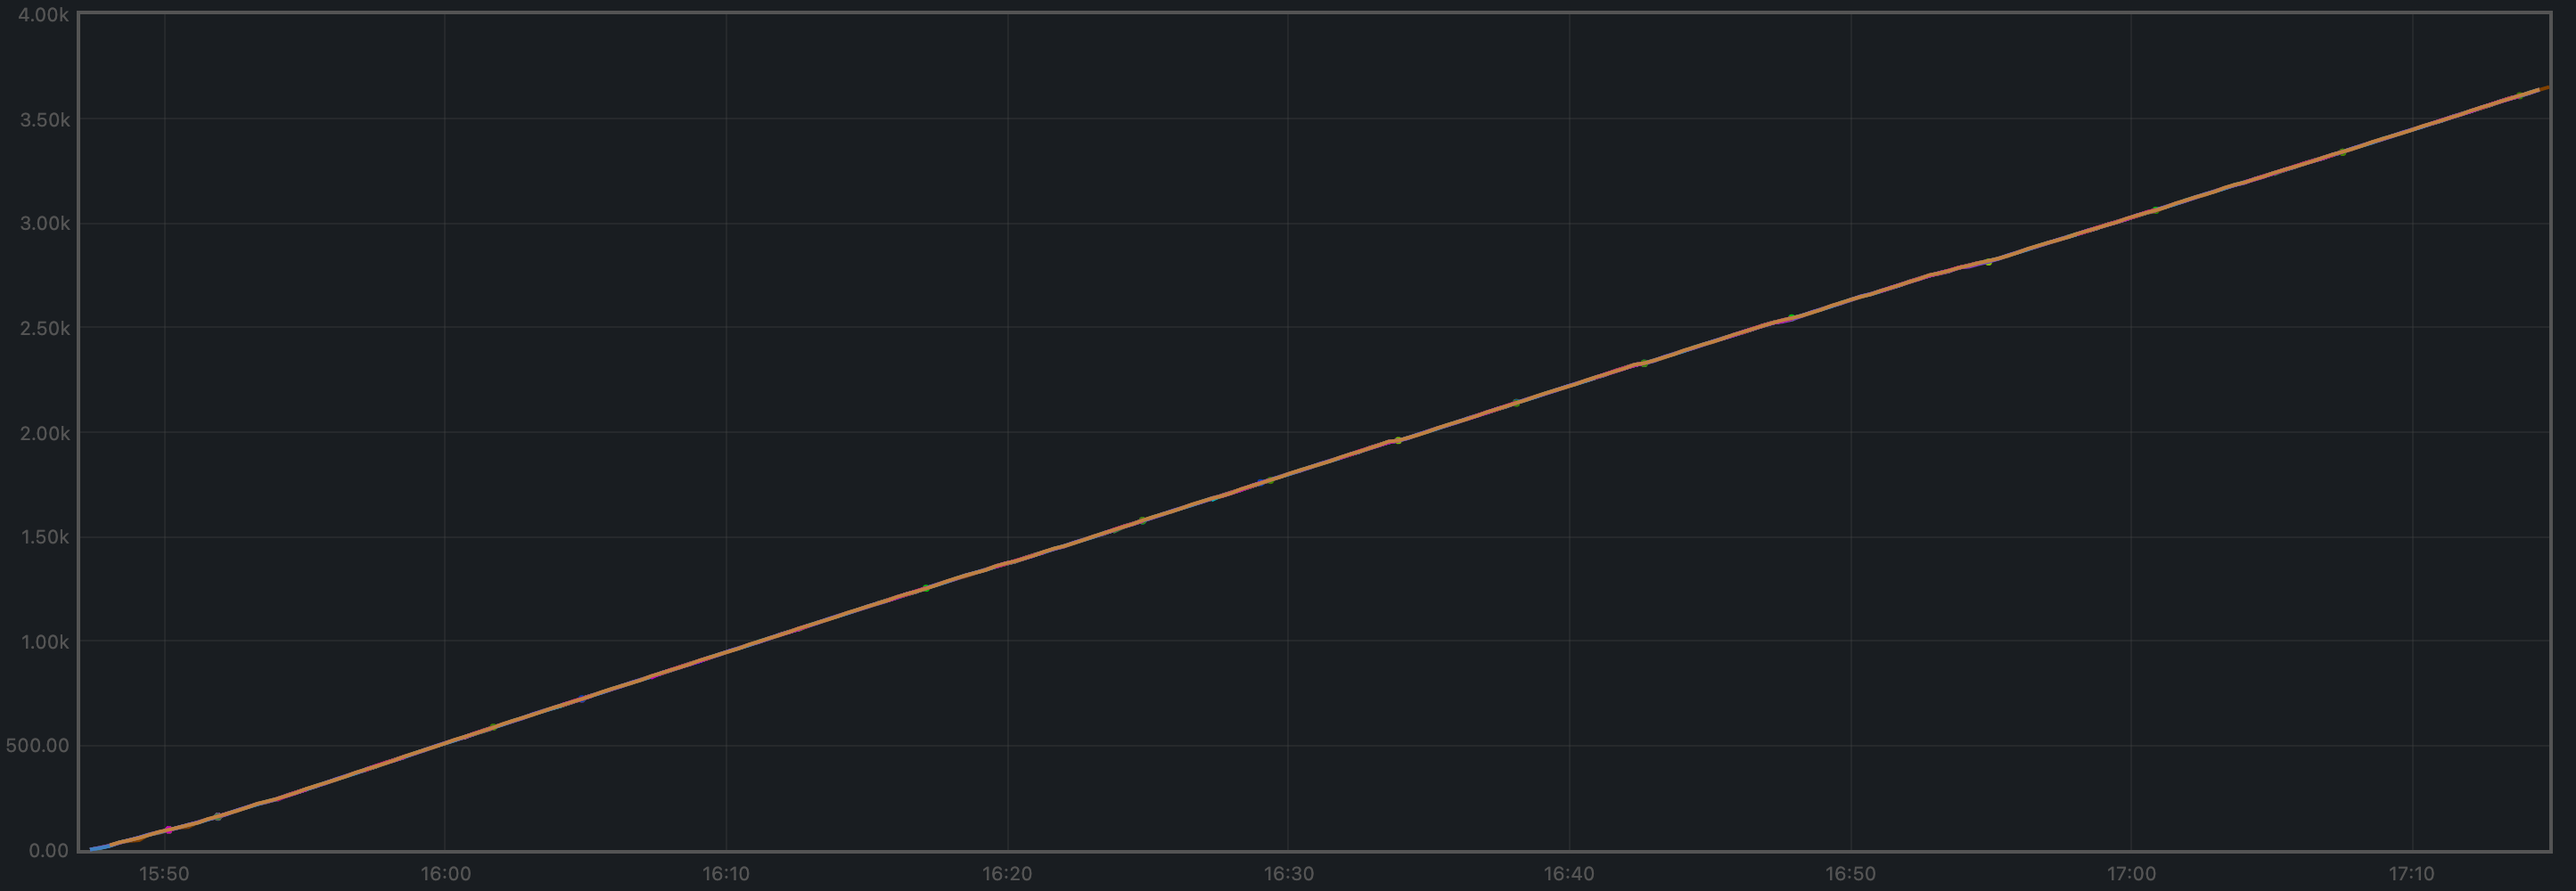 在 5229 秒内,高度从 2 增长到 3638。
由此得出平均每分钟产生 41 个区块。
下图仅显示临时节点上报的高度
(这些数据也包含在上图中)。请注意,height 指标
只有在节点切换到共识之后才会显示,因此当节点被终止、清空、从零启动并追赶时,会出现间隔。
在 5229 秒内,高度从 2 增长到 3638。
由此得出平均每分钟产生 41 个区块。
下图仅显示临时节点上报的高度
(这些数据也包含在上图中)。请注意,height 指标
只有在节点切换到共识之后才会显示,因此当节点被终止、清空、从零启动并追赶时,会出现间隔。
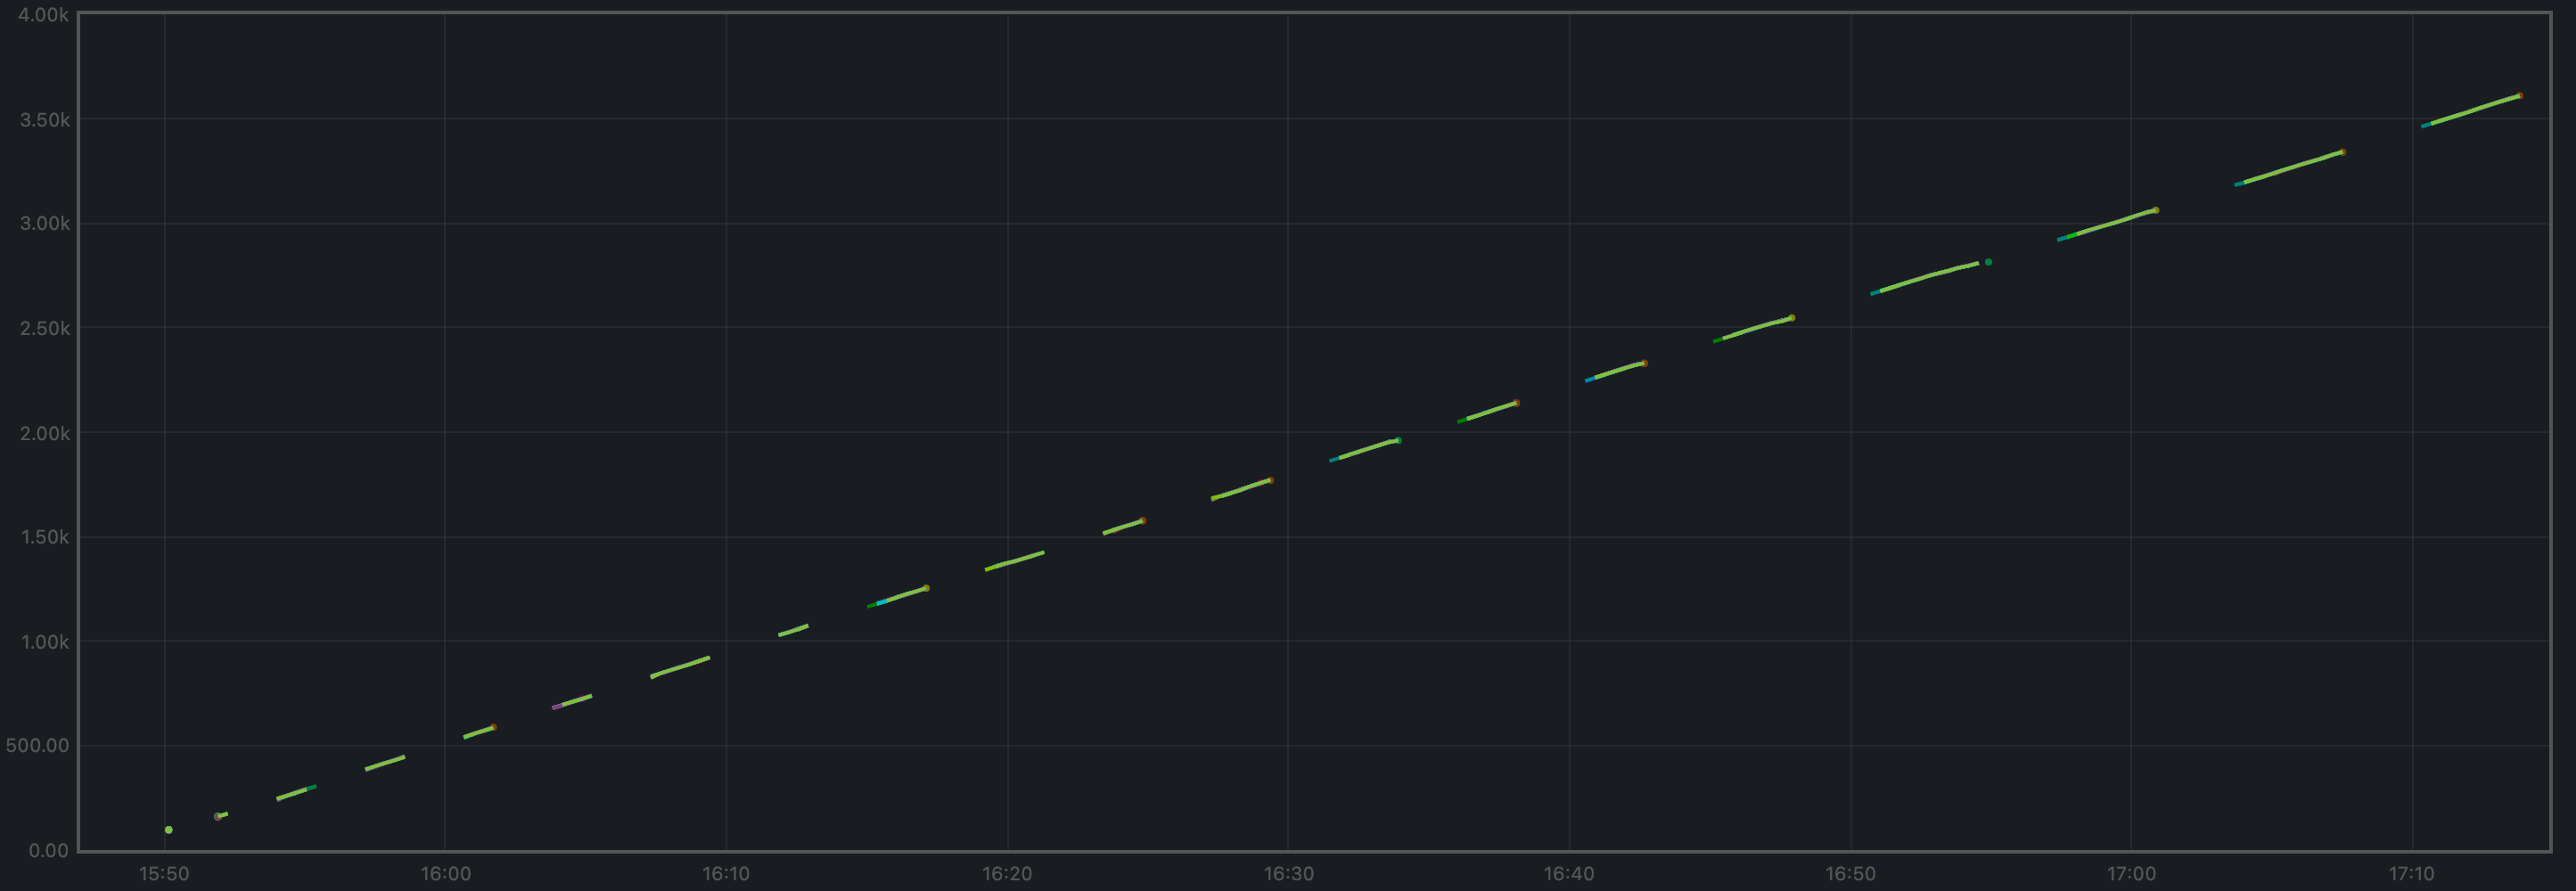 每分钟处理的交易数是下图的梯度。
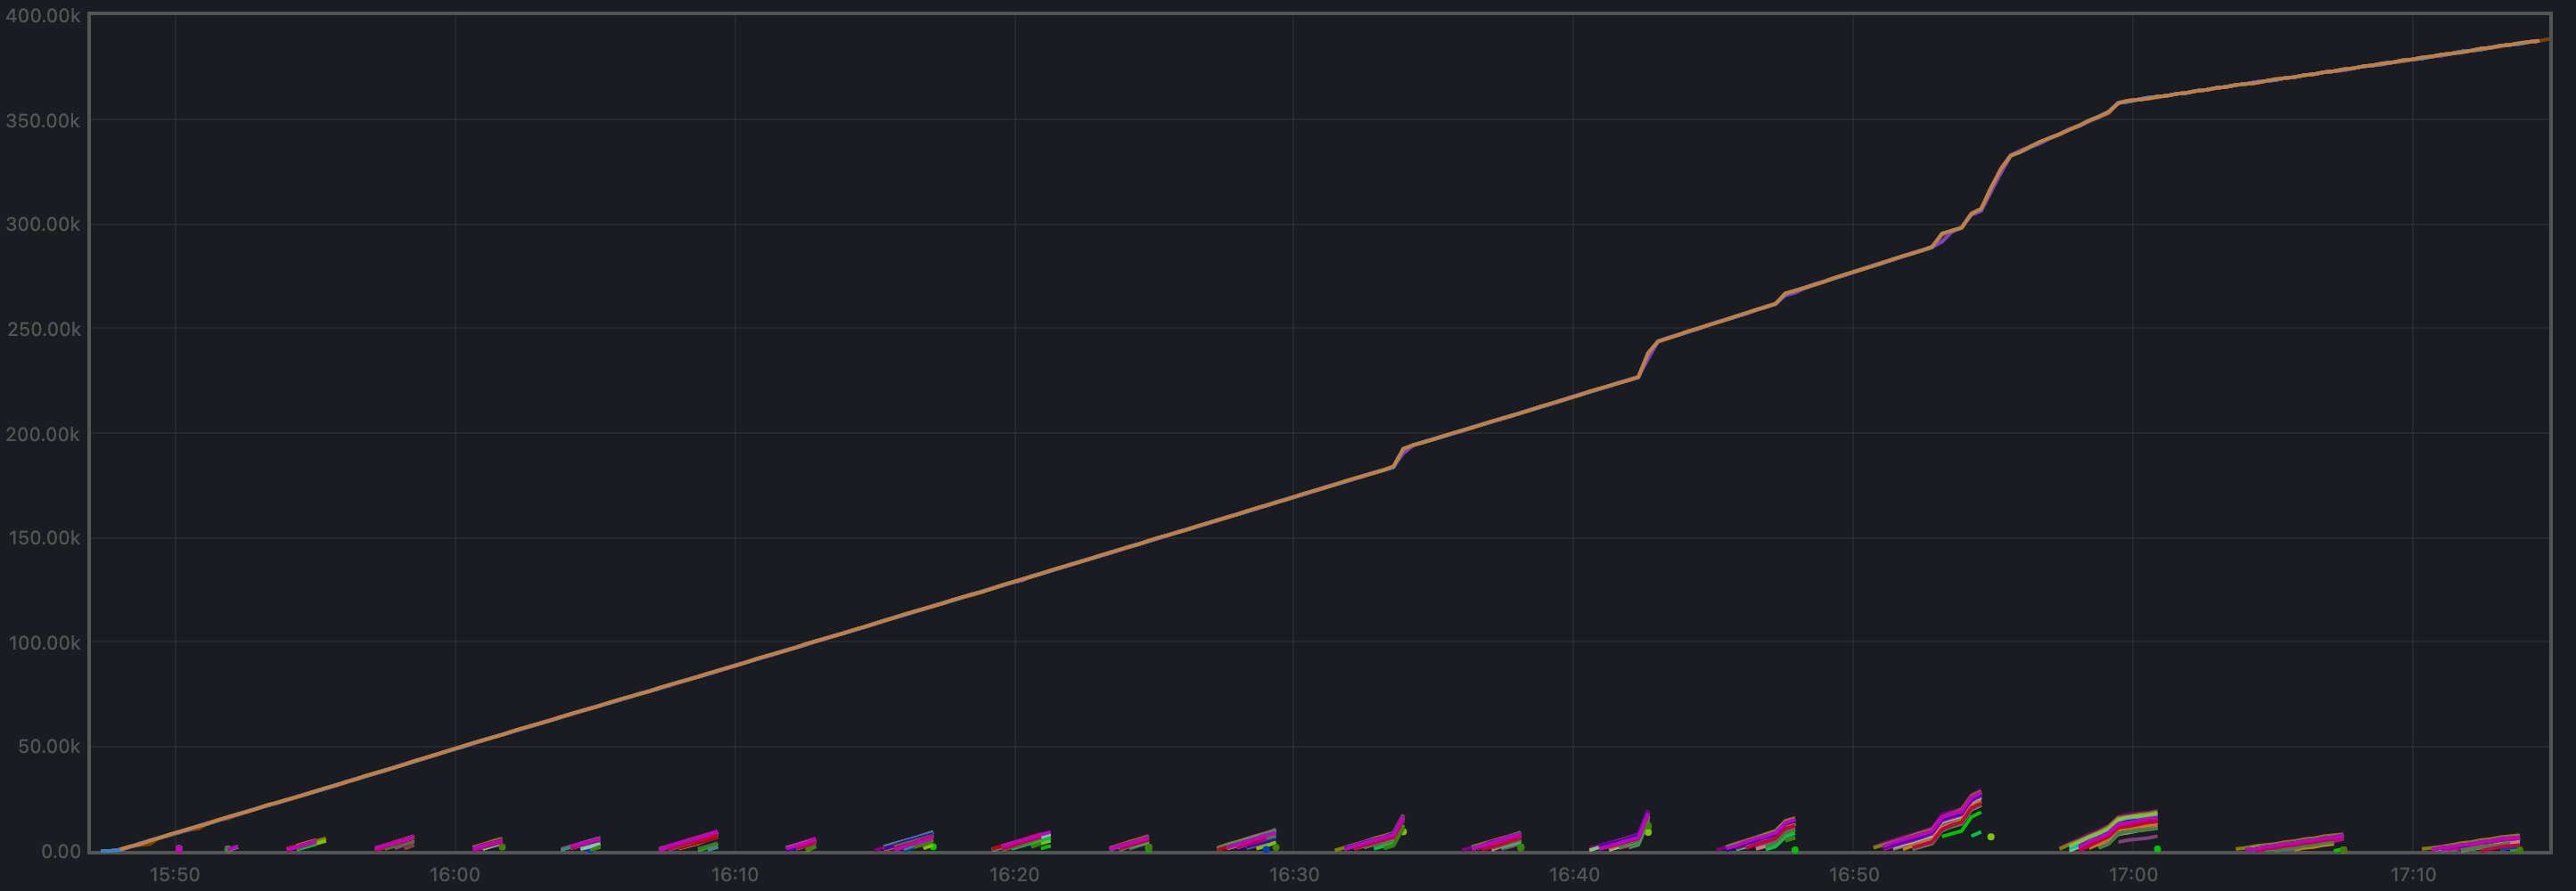 我们周期性地看到靠近
 y=0 的那些小线段,
是临时节点在追赶完成后开始处理的交易。
在 5229 秒内,总数从 0 增长到 387697 笔交易,
结果为每分钟 4449 笔交易。我们可以看到图表梯度中有一些突变。
这一点还需要进一步调查。
对等节点
下图展示了整个实验期间对等节点数量的变化。 观察到的周期性变化,是由于临时节点被停止、清空并重新创建所致。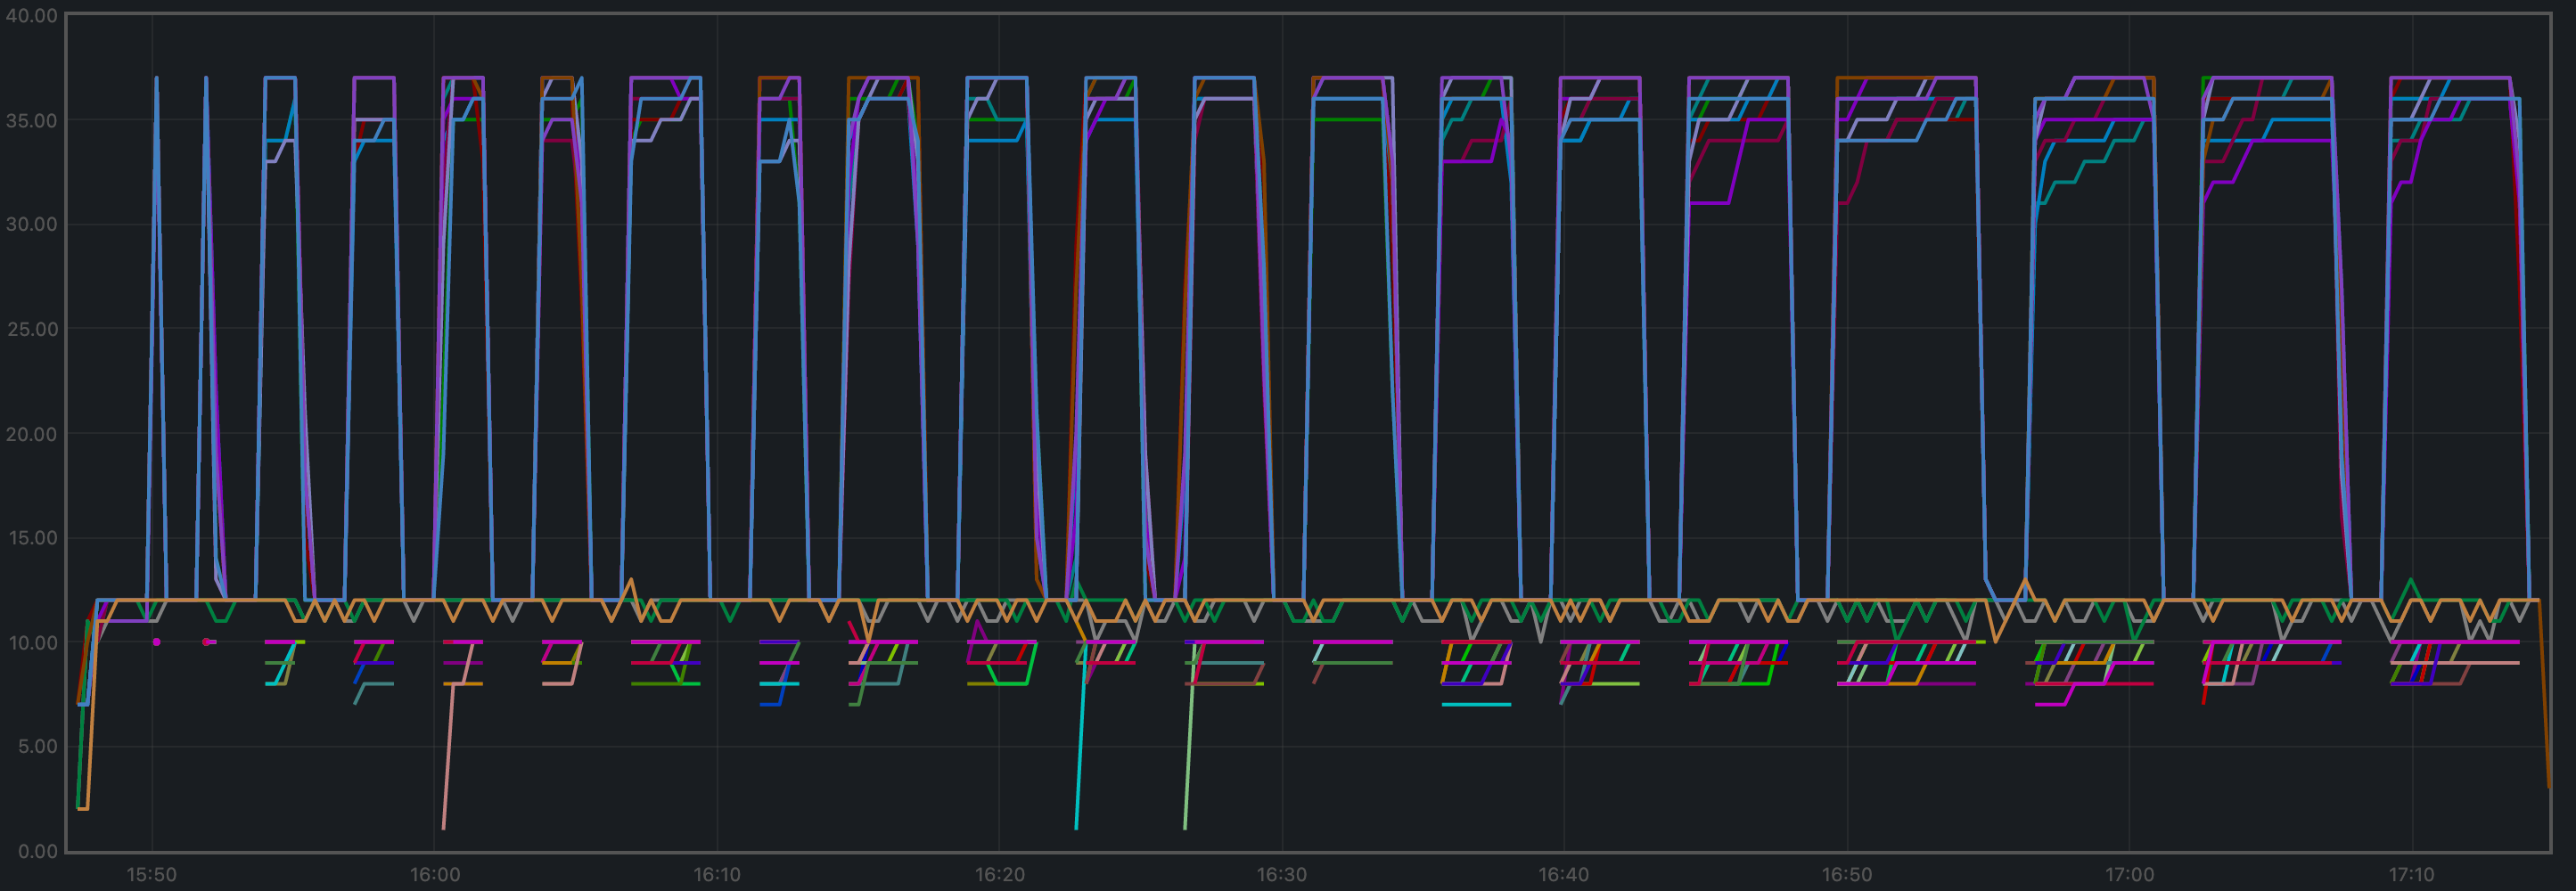 验证者的曲线集中在图的较高区域,而临时节点大多位于较低区域。
常驻内存集大小
所有进程的平均常驻内存集大小(RSS)看起来较为稳定,并在末尾略有增长。 这可能与上文观察到的交易负载增加有关。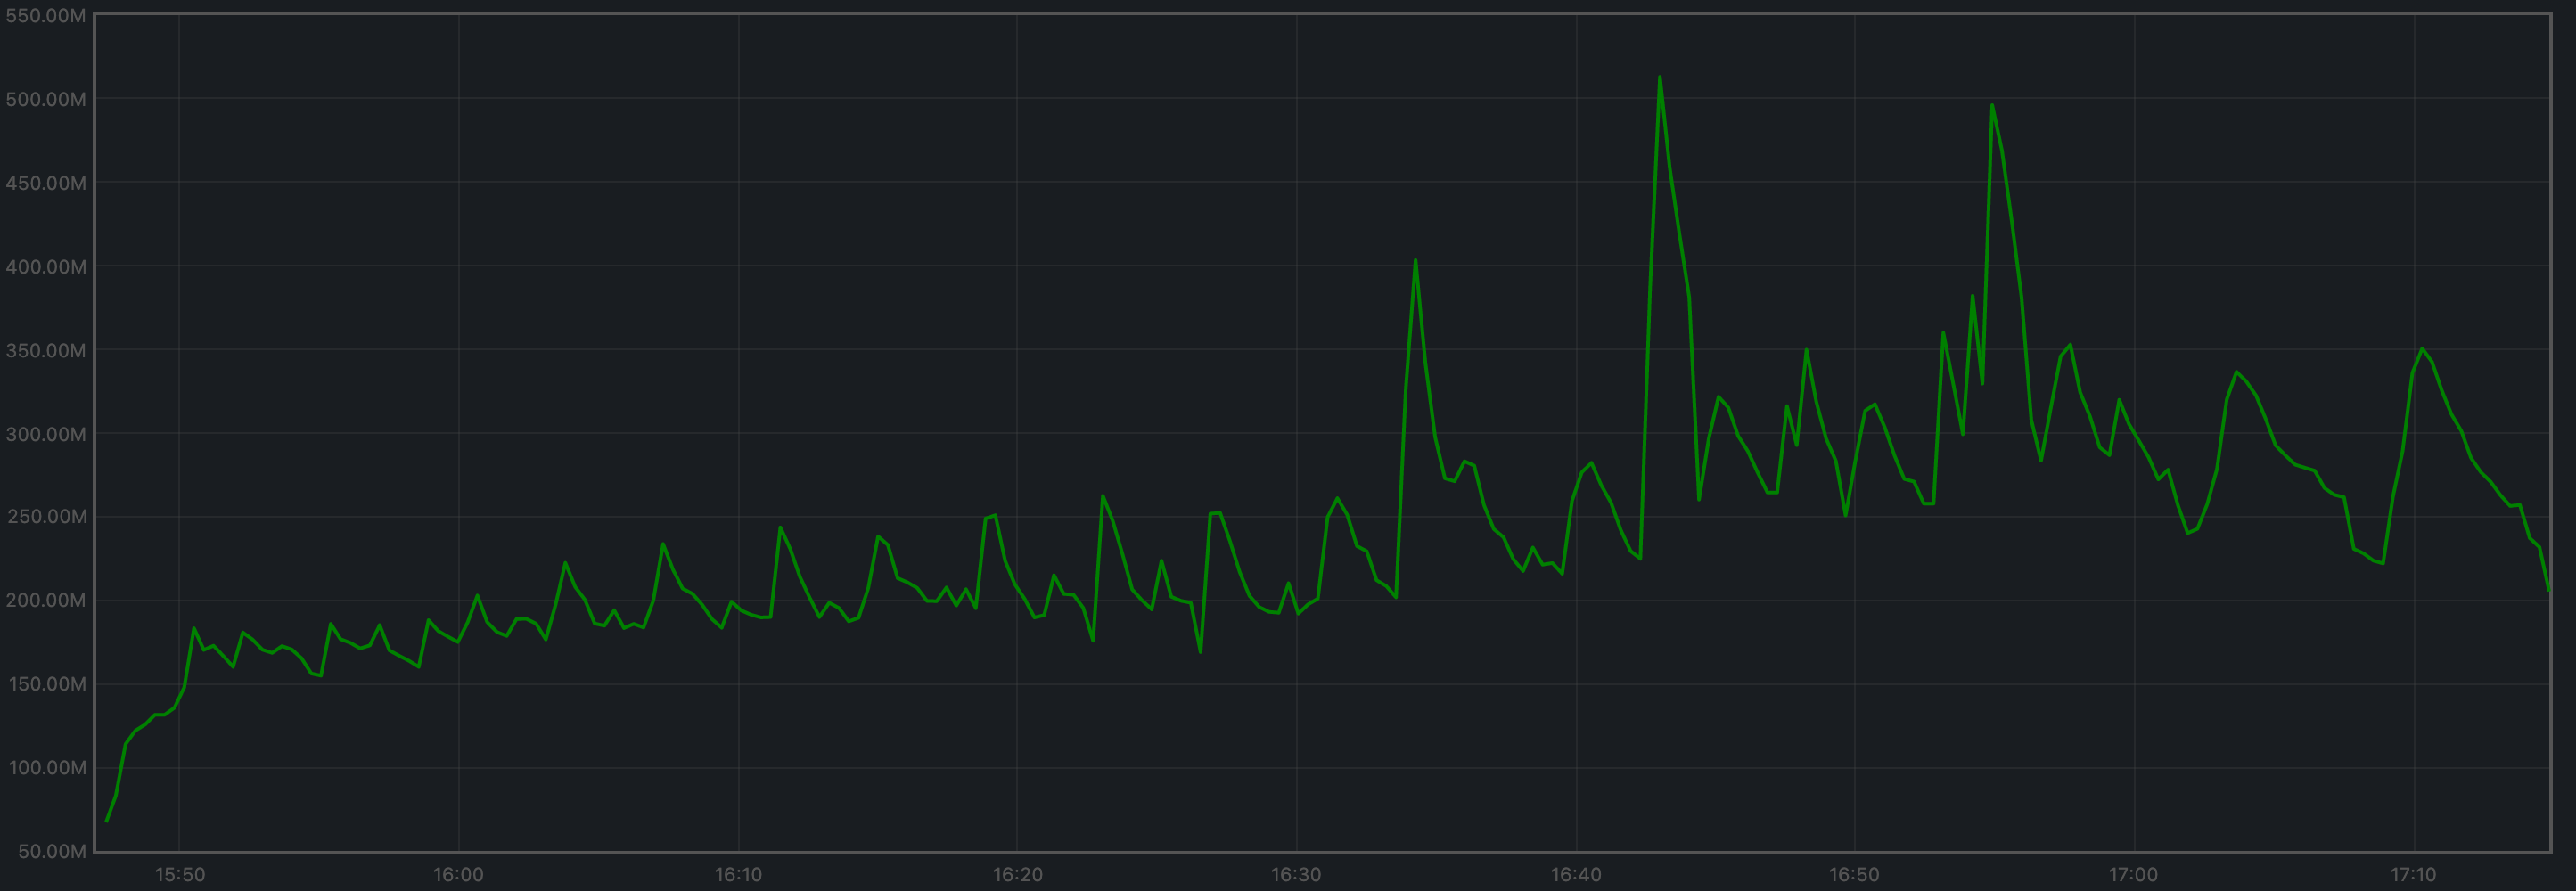 验证者与临时节点(在线时)占用的内存规模相近。
CPU 利用率
下图展示了所有节点的load1 指标。
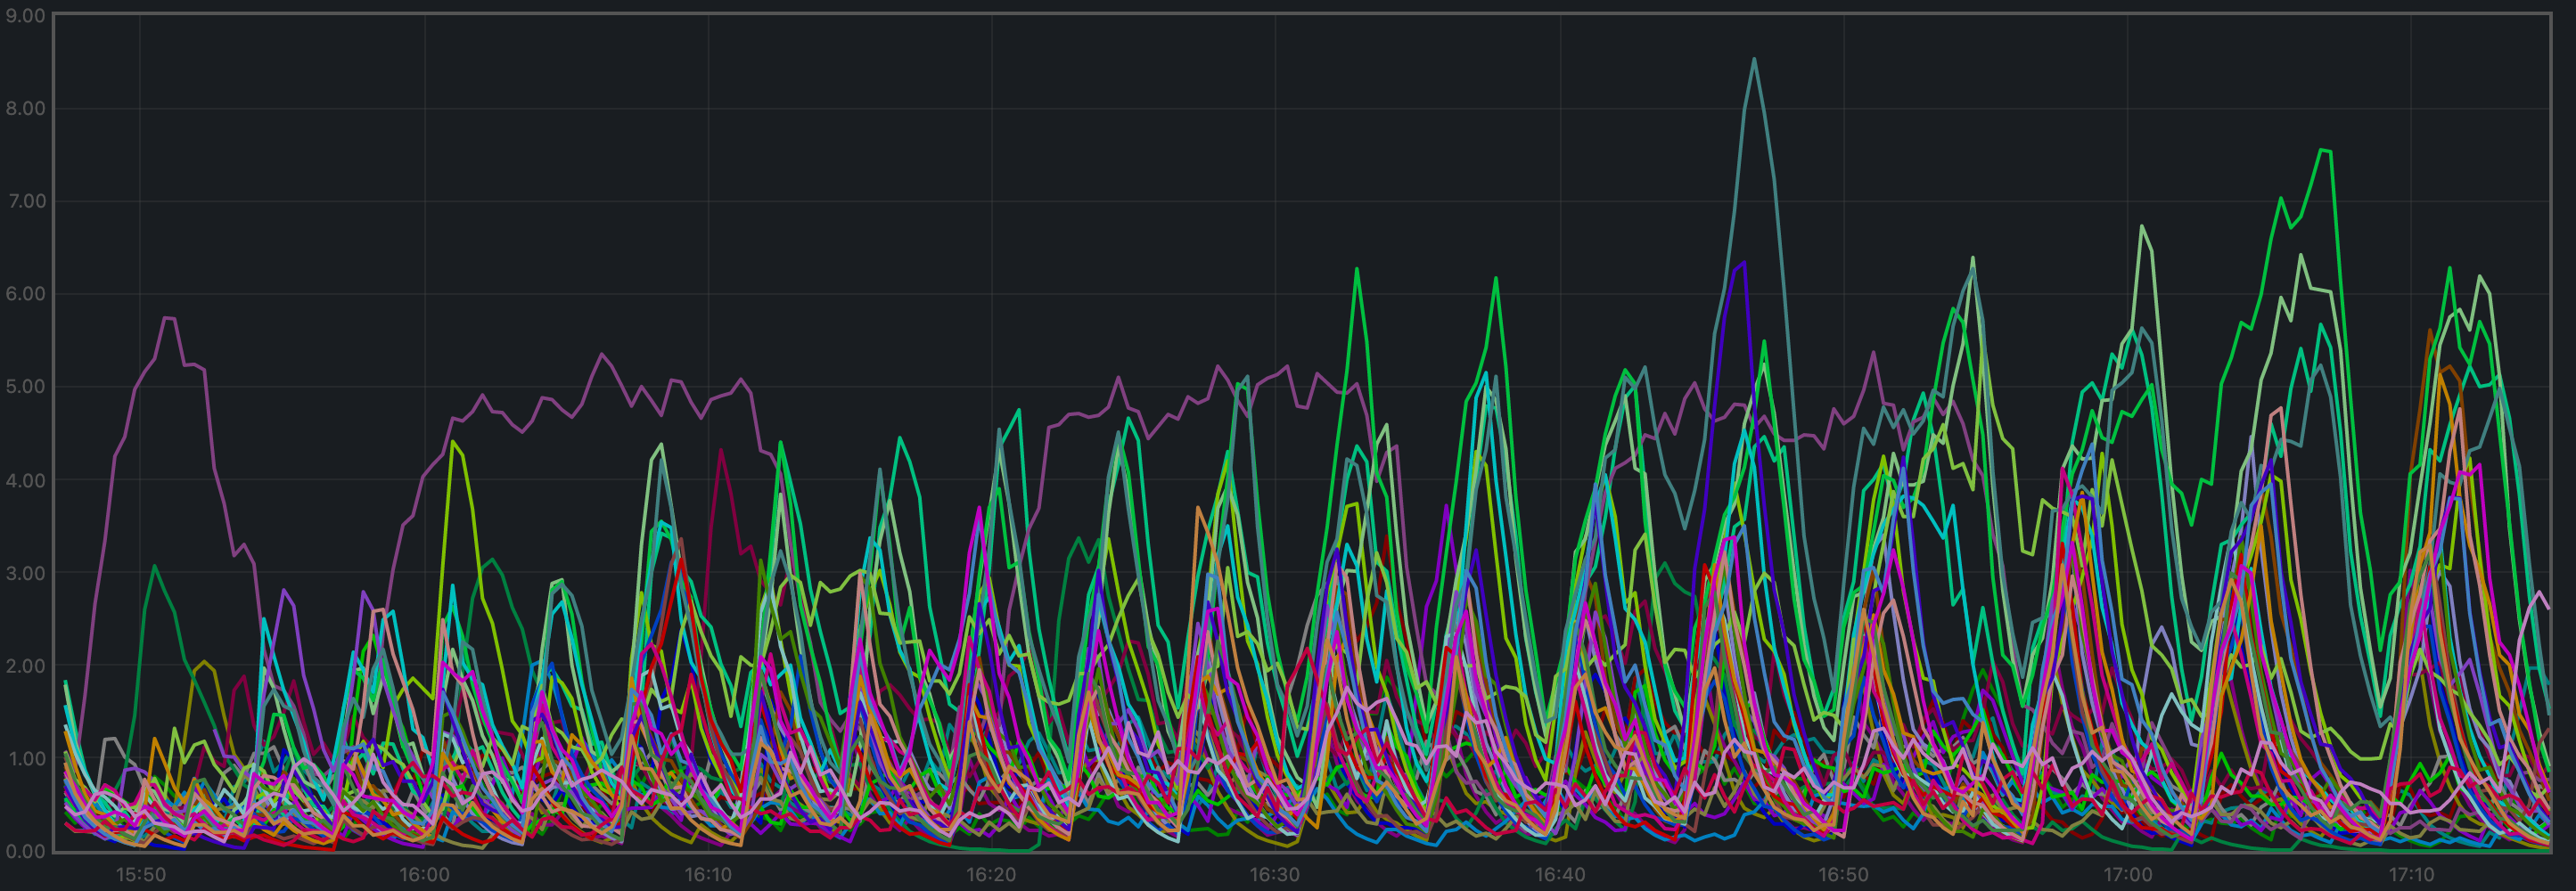 在大多数时间里,它都低于 5,这被视为正常负载。
那条呈现不同模式的紫色曲线,对应的是通过 RPC 从负载生成器进程接收所有交易的验证者。
在大多数时间里,它都低于 5,这被视为正常负载。
那条呈现不同模式的紫色曲线,对应的是通过 RPC 从负载生成器进程接收所有交易的验证者。
测试结果
结果:N/A 日期:2022-10-10 版本:a28c987f5a604ff66b515dd415270063e6fb069dTendermint Core QA 测试结果 v0.34.x
200 节点测试网
寻找饱和点
在检查测试结果时,首要目标是识别饱和点。 饱和点指的是一种交易负载足够高、以至于测试网无法保持稳定的配置: 负载生成器试图产生略多于测试网可处理数量的交易。 下表汇总了 v0.34.x 在不同实验中的结果 (摘自文件v034_report_tabbed.txt)。
该表的 X 轴是 c,表示负载生成器进程到目标节点创建的连接数。
该表的 Y 轴是 r,表示每秒发送的交易速率或数量。
| c=1 | c=2 | c=4 | |
|---|---|---|---|
| r=25 | 2225 | 4450 | 8900 |
| r=50 | 4450 | 8900 | 17800 |
| r=100 | 8900 | 17800 | 35600 |
| r=200 | 17800 | 35600 | 38660 |
c),以及负载生成器尝试产生的每秒交易数(r)。请注意,该工具尝试生成的总体负载为 。
我们可以看到,饱和点位于跨越以下单元格的对角线之外:
r=200,c=2r=100,c=4
r=200,c=4)都有一个共同点:处理的交易总数明显低于 (89 秒,因为最后一批交易从未发送),而这个值是在系统能够良好承载负载时预期的交易数量。
在(r=200,c=4)条件下,我们得到 38660,而理论上的交易数量应为
。
此时,我们选择了一个位于饱和对角线边界上的实验,
以便进一步研究该版本的性能。
所选实验为(r=200,c=2)。
下图展示了在(r=200,c=2)条件下负载生成器的 CPU 负载(top 输出的 1 分钟平均值),
可以看到在大多数时间里负载都接近 0。
延迟分析
这里描述的方法使我们能够绘制所有实验中的交易延迟。
可以看到,即使是位于饱和对角线之外的实验,也仍然能够保持交易延迟稳定(即不会持续增长)。
我们的解释是,Tendermint Core 内部的争用通过 websockets 传播到了负载生成器;
因此,负载生成器无法产生目标负载,只能产生其中的一部分。
对 Prometheus 数据的进一步检查(见下文)表明,内存池在稳态下包含大量交易,
但其规模并未明显增长,而是会很快回到这一稳态。这表明
Tendermint Core 网络处理交易的速度至少与交易提交到 mempool 的速度一样快。
最后,测试脚本确保在实验结束时,mempool 为空,
从而保证所有提交到链上的交易都已被处理。
最后,图中的点数看起来明显少于预期,尤其是在接近或高于饱和对角线时,
而每个实验中的交易数量实际上更多。这是图形呈现带来的视觉效果;
图中看起来像单个点的对象,实际上可能是非常庞大的点簇。为佐证这一点,我们通过设置(精心选择的)极小坐标轴区间,对上图进行了放大。下方显示的点簇,在上图中看起来就像一个单点。
该延迟图可作为与其他版本进行比较的基线。
下图汇总了在不同 WebSocket 连接数下,向节点加载交易时的平均延迟与总体吞吐量之间的关系。
所选实验的 Prometheus 指标
如上文所述,所选实验为r=200,c=2。
本节进一步分析从 Prometheus 数据中提取的该实验关键指标。
内存池大小
内存池大小即 mempool 中交易数量的计数,在所有全节点上都表现为稳定且分布均匀。 它没有出现任何不受约束的增长。 下图展示了在某一时刻,所有全节点 mempool 中交易累计数量随时间的变化。 图中可见的两个尖峰,对应于某些节点上的共识实例推进到了初始轮次之后的阶段。
下图展示了所有全节点平均值随时间的变化,其未处理交易数在 1500 到 2000 之间波动。
观察到的峰值与某些节点推进到初始共识轮次之后的时刻一致(见下文)。
对等节点
所有节点上的对等节点数量都很稳定。 种子节点的数量更高(约 140),其余节点则在 21 到 74 之间。 非种子节点之所以会超过 50 个对等节点,是由于 #9548。
每个高度的共识轮次
大多数节点在大多数高度上只使用第 0 轮,但某些节点在部分高度上需要推进到第 1 轮。
每分钟产生的区块数、每分钟处理的交易数
每分钟产生的区块数就是下图曲线的斜率。
在 2 分钟内,高度从 530 增长到 569。
由此得出平均每分钟产生 19.5 个区块。
每分钟处理的交易数就是下图曲线的斜率。
在 2 分钟内,总数从 64525 增长到 100125 笔交易,
结果为每分钟 17800 笔交易。不过,从图中可以看到,
负载中的所有交易在这两分钟结束之前很久就已经处理完成。
如果我们根据交易实际被处理的时间窗口(约 105 秒)进行调整,
则得到每分钟 20343 笔交易。
常驻内存集大小
下图绘制了所有被监控进程的常驻内存集大小(Resident Set Size)。
所有进程的平均值在 1.2 GiB 左右波动,未显示出不受约束的增长。
CPU 利用率
在 Unix 机器上,从 Prometheus 角度衡量 CPU 利用率的最佳指标是load1,因为它通常会出现在
top 的输出中。
在大多数情况下,它都低于 5,这通常被认为是可接受的负载水平。
测试结果
结果:N/A(v0.34.x 是基线) 日期:2022-10-14 版本:3ec6e424d6ae4c96867c2dcf8310572156068bb6轮换节点测试网
对于该测试网,我们将使用一个可以安全地视为低于其饱和点的负载 (该测试网规模在 13 到 38 个全节点之间):c=4,r=800。
注:用于这些测试的 CometBFT 版本受 #9539 影响。
不过,到达 mempool 的负载减少这一点,与我们此处关注的功能是正交的。
延迟
所有延迟的图表如下所示。
可以观察到,在测试后期出现了一些非常高的延迟。
怀疑它们是重复交易后,我们检查了延迟原始文件,
并发现存在超过 10 万笔重复交易。
下图展示了移除了所有重复交易后的延迟文件,
也就是说,对于重复交易只保留其首次出现。
这个存在于 v0.34.x 中的问题需要被解决,也许可以采用与我们在高负载下运行 200 节点测试时相同的方法:增大 cache_size 配置参数。
Prometheus 指标
这里展示的指标集合比 200 节点实验更少。 我们只关注那些可能受到追赶过程(blocksync)影响的指标。每分钟区块数与交易数
与 200 节点测试中展示的一样,每分钟产生的区块数是下图的梯度。
在 5229 秒内,高度从 2 增长到 3638。
由此得出平均每分钟产生 41 个区块。
下图仅显示临时节点上报的高度
(这些数据也包含在上图中)。请注意,height 指标
只有在节点切换到共识之后才会显示,因此当节点被终止、清空、从零启动并追赶时,会出现间隔。
每分钟处理的交易数是下图的梯度。
我们周期性地看到靠近 y=0 的那些小线段,
是临时节点在追赶完成后开始处理的交易。
在 5229 秒内,总数从 0 增长到 387697 笔交易,
结果为每分钟 4449 笔交易。我们可以看到图表梯度中有一些突变。
这一点还需要进一步调查。
对等节点
下图展示了整个实验期间对等节点数量的变化。 观察到的周期性变化,是由于临时节点被停止、清空并重新创建所致。
验证者的曲线集中在图的较高区域,而临时节点大多位于较低区域。
常驻内存集大小
所有进程的平均常驻内存集大小(RSS)看起来较为稳定,并在末尾略有增长。 这可能与上文观察到的交易负载增加有关。
验证者与临时节点(在线时)占用的内存规模相近。
CPU 利用率
下图展示了所有节点的load1 指标。
在大多数时间里,它都低于 5,这被视为正常负载。
那条呈现不同模式的紫色曲线,对应的是通过 RPC 从负载生成器进程接收所有交易的验证者。
测试结果
结果:N/A 日期:2022-10-10 版本:a28c987f5a604ff66b515dd415270063e6fb069dTendermint Core QA Results v0.34.x
200 Node Testnet
Finding the Saturation Point
The first goal when examining the results of the tests is identifying the saturation point. The saturation point is a setup with a transaction load large enough to prevent the testnet from being stable: the load runner tries to produce slightly more transactions than can be processed by the testnet. The following table summarizes the results for v0.34.x for the different experiments (extracted from filev034_report_tabbed.txt).
The X axis of this table is c, the number of connections created by the load runner process to the target node.
The Y axis of this table is r, the rate or number of transactions issued per second.
| c=1 | c=2 | c=4 | |
|---|---|---|---|
| r=25 | 2225 | 4450 | 8900 |
| r=50 | 4450 | 8900 | 17800 |
| r=100 | 8900 | 17800 | 35600 |
| r=200 | 17800 | 35600 | 38660 |
c)
to a chosen validator and the number of transactions per second that the load runner
tries to produce (r). Note that the overall load the tool attempts to generate is .
We can see that the saturation point is beyond the diagonal that spans cells
r=200,c=2r=100,c=4
r=200,c=4) have in common that the total
number of transactions processed is noticeably less than the product (89 seconds, since the last batch never gets sent),
which is the expected number of transactions when the system is able to handle the load well.
With (r=200,c=4), we obtained 38660, whereas the theoretical number of transactions should
have been .
At this point, we chose an experiment at the limit of the saturation diagonal
in order to further study the performance of this release.
The chosen experiment is (r=200,c=2).
This is a plot of the CPU load (average over 1 minute, as output by top) of the load runner for (r=200,c=2),
where we can see that the load stays close to 0 most of the time.
Examining Latencies
The method described here allows us to plot the latencies of transactions for all experiments.
As we can see, even the experiments beyond the saturation diagonal managed to keep
transaction latency stable (i.e., not constantly increasing).
Our interpretation is that contention within Tendermint Core was propagated
via the websockets to the load runner;
hence, the load runner could not produce the target load but a fraction of it.
Further examination of the Prometheus data (see below) showed that the mempool contained many transactions
at steady state but did not grow much without quickly returning to this steady state. This demonstrates
that the Tendermint Core network was able to process transactions at least as quickly as they
were submitted to the mempool. Finally, the test script ensured that at the end of an experiment, the
mempool was empty so that all transactions submitted to the chain were processed.
Finally, the number of points present in the plot appears to be much less than expected given the
number of transactions in each experiment, particularly close to or above the saturation diagonal.
This is a visual effect of the plot; what appear to be points in the plot are actually potentially huge
clusters of points. To corroborate this, we have zoomed in the plot above by setting (carefully chosen)
tiny axis intervals. The cluster shown below looks like a single point in the plot above.
The plot of latencies can be used as a baseline to compare with other releases.
The following plot summarizes average latencies versus overall throughput
across different numbers of WebSocket connections to the node into which
transactions are being loaded.
Prometheus Metrics on the Chosen Experiment
As mentioned above, the chosen experiment isr=200,c=2.
This section further examines key metrics for this experiment extracted from Prometheus data.
Mempool Size
The mempool size, a count of the number of transactions in the mempool, was shown to be stable and homogeneous at all full nodes. It did not exhibit any unconstrained growth. The plot below shows the evolution over time of the cumulative number of transactions inside all full nodes’ mempools at a given time. The two spikes that can be observed correspond to a period where consensus instances proceeded beyond the initial round at some nodes.
The plot below shows the evolution of the average over all full nodes, which oscillates between 1500 and 2000
outstanding transactions.
The peaks observed coincide with the moments when some nodes proceeded beyond the initial round of consensus (see below).
Peers
The number of peers was stable at all nodes. It was higher for the seed nodes (around 140) than for the rest (between 21 and 74). The fact that non-seed nodes reach more than 50 peers is due to #9548.
Consensus Rounds per Height
Most nodes used only round 0 for most heights, but some nodes needed to advance to round 1 for some heights.
Blocks Produced per Minute, Transactions Processed per Minute
The blocks produced per minute are the slope of this plot.
Over a period of 2 minutes, the height goes from 530 to 569.
This results in an average of 19.5 blocks produced per minute.
The transactions processed per minute are the slope of this plot.
Over a period of 2 minutes, the total goes from 64525 to 100125 transactions,
resulting in 17800 transactions per minute. However, we can see in the plot that
all transactions in the load are processed long before the two minutes.
If we adjust the time window for when transactions are processed (approx. 105 seconds),
we obtain 20343 transactions per minute.
Memory Resident Set Size
Resident Set Size of all monitored processes is plotted below.
The average over all processes oscillates around 1.2 GiB and does not demonstrate unconstrained growth.
CPU Utilization
The best metric from Prometheus to gauge CPU utilization on a Unix machine isload1,
as it usually appears in the
output of top.
It is contained in most cases below 5, which is generally considered acceptable load.
Test Result
Result: N/A (v0.34.x is the baseline) Date: 2022-10-14 Version: 3ec6e424d6ae4c96867c2dcf8310572156068bb6Rotating Node Testnet
For this testnet, we will use a load that can safely be considered below the saturation point for the size of this testnet (between 13 and 38 full nodes):c=4,r=800.
N.B.: The version of CometBFT used for these tests is affected by #9539.
However, the reduced load that reaches the mempools is orthogonal to the functionality
we are focusing on here.
Latencies
The plot of all latencies can be seen in the following plot.
We can observe there are some very high latencies toward the end of the test.
Upon suspicion that they are duplicate transactions, we examined the latencies
raw file and discovered there are more than 100K duplicate transactions.
The following plot shows the latencies file where all duplicate transactions have
been removed, i.e., only the first occurrence of a duplicate transaction is kept.
This problem, existing in v0.34.x, will need to be addressed, perhaps in the same way
we addressed it when running the 200 node test with high loads: increasing the cache_size
configuration parameter.
Prometheus Metrics
The set of metrics shown here are fewer than for the 200 node experiment. We are only interested in those for which the catch-up process (blocksync) may have an impact.Blocks and Transactions per Minute
Just as shown for the 200 node test, the blocks produced per minute are the gradient of this plot.
Over a period of 5229 seconds, the height goes from 2 to 3638.
This results in an average of 41 blocks produced per minute.
The following plot shows only the heights reported by ephemeral nodes
(which are also included in the plot above). Note that the height metric
is only shown once the node has switched to consensus, hence the gaps
when nodes are killed, wiped out, started from scratch, and catching up.
The transactions processed per minute are the gradient of this plot.
The small lines we see periodically close to y=0 are the transactions that
ephemeral nodes start processing when they are caught up.
Over a period of 5229 seconds, the total goes from 0 to 387697 transactions,
resulting in 4449 transactions per minute. We can see some abrupt changes in
the plot’s gradient. This will need to be investigated.
Peers
The plot below shows the evolution in peers throughout the experiment. The periodic changes observed are due to the ephemeral nodes being stopped, wiped out, and recreated.
The validators’ plots are concentrated at the higher part of the graph, whereas the ephemeral nodes
are mostly at the lower part.
Memory Resident Set Size
The average Resident Set Size (RSS) over all processes seems stable and slightly growing toward the end. This might be related to the increase in transaction load observed above.
The memory taken by the validators and the ephemeral nodes (when they are up) is comparable.
CPU Utilization
The plot shows metricload1 for all nodes.
It is contained under 5 most of the time, which is considered normal load.
The purple line, which follows a different pattern, is the validator receiving all
transactions via RPC from the load runner process.