

CometBFT QA 结果 v0.38.x
本轮 QA 在 CometBFTv0.38.0-alpha.2 上运行,这是 CometBFT 仓库中的第二个 v0.38.x 版本。
相对于基线版本(2023 年 2 月 21 日的 v0.37.0-alpha.3),本版本的变更包括引入 FinalizeBlock 方法,以补全完整的 ABCI++ 功能范围(ABCI 2.0),以及更新日志中描述的若干其他改进。
发现的问题
- (严重,已修复)#539 和 #546 - 该缺陷会导致 proposer 在
PrepareProposal中崩溃,因为它应当拥有扩展时却没有。 这种情况主要发生在 proposer 正在追赶状态时。 - (严重,已修复)#562 - 指标相关逻辑中存在若干缺陷,在测试网启动时会触发 panic。
200 节点测试网
与 QA 过程的其他迭代一样,我们使用了一个 200 节点网络作为测试平台,并额外加入了一些节点来施加负载和收集指标。饱和点
与以往的 QA 实验一样,我们首先找出系统开始出现性能下降时的交易负载。随后,我们在略低于饱和点的负载下运行实验。用于识别饱和点的方法可见这里,其在基线版本上的应用见这里。 下表汇总了不同实验的结果(摘自v038_report_tabbed.txt)。X 轴(c)表示负载发生器进程到目标节点建立的连接数。Y 轴(r)表示每秒发出的交易速率或数量。
| c=1 | c=2 | c=4 | |
|---|---|---|---|
| r=200 | 17800 | 33259 | 33259 |
| r=400 | 35600 | 41565 | 41384 |
| r=800 | 36831 | 38686 | 40816 |
| r=1600 | 40600 | 45034 | 39830 |
c=1,r=400 和 c=2,r=200 定义的对角线之外进入饱和。对角线上的条目具有相同的交易负载,因此可以视为等价。对于选定的对角线,预期处理的交易数为 1 * 400 tx/s * 89 s = 35600。(注意,我们使用实验 90 秒中的 89 秒,因为最后一批交易与实验结束同时发生,因此不会被发送。)位于其下一条对角线的实验预期处理数量是其两倍,即 1 * 800 tx/s * 89 s = 71200,但系统无法处理这样的负载,因此已达到饱和。
因此,在后续实验中,我们选择 c=1,r=400 作为配置。我们本来也可以选择等价的 c=2,r=200,这也是基线版本使用的配置,但为简化起见,我们决定使用只有一个连接的方案。
另外需要注意的是,相比之前的 QA 测试,我们尝试在更高的 r 取值范围内寻找饱和点。具体来说,本次测试中 r 取值为 200 或更高,而之前的测试中 r 为 200 或更低。特别是,对于基线版本,我们没有运行配置 c=1,r=400 的实验。
作为对比,下表展示了基线版本的结果,其中饱和点位于由 r=200,c=2 和 r=100,c=4 定义的对角线之外。
| c=1 | c=2 | c=4 | |
|---|---|---|---|
| r=25 | 2225 | 4450 | 8900 |
| r=50 | 4450 | 8900 | 17800 |
| r=100 | 8900 | 17800 | 35600 |
| r=200 | 17800 | 35600 | 38660 |
延迟
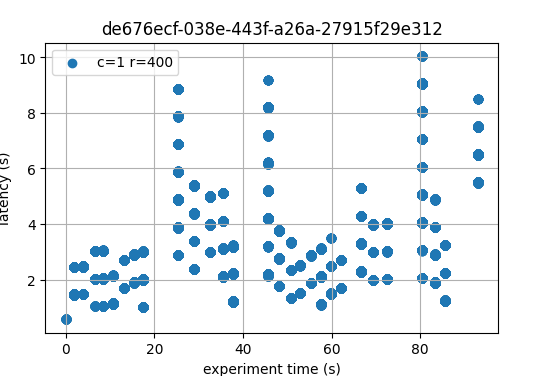
下图展示了使用配置c=1,r=400 运行的实验延迟。
 作为参考,下图展示了基线版本中某次
 c=2,r=200 实验的延迟。
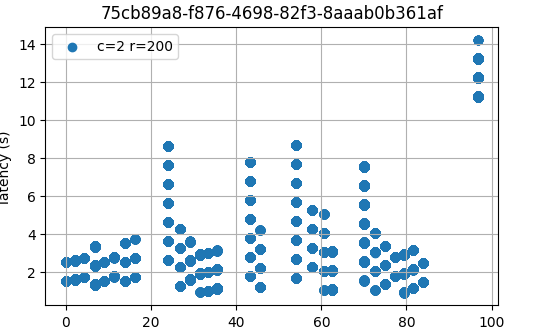 可以看到,在大多数情况下,两者的延迟非常接近;在某些情况下,基线版本的延迟还略高于被测版本。因此,从这个小规模实验可以认为,两者测得的延迟是等价的,或者至少可以说被测版本并不比基线更差。
所选实验的 Prometheus 指标
本节进一步分析从 Prometheus 数据中提取出的关键指标,这些数据对应所选的c=1,r=400 配置实验。
Mempool 大小
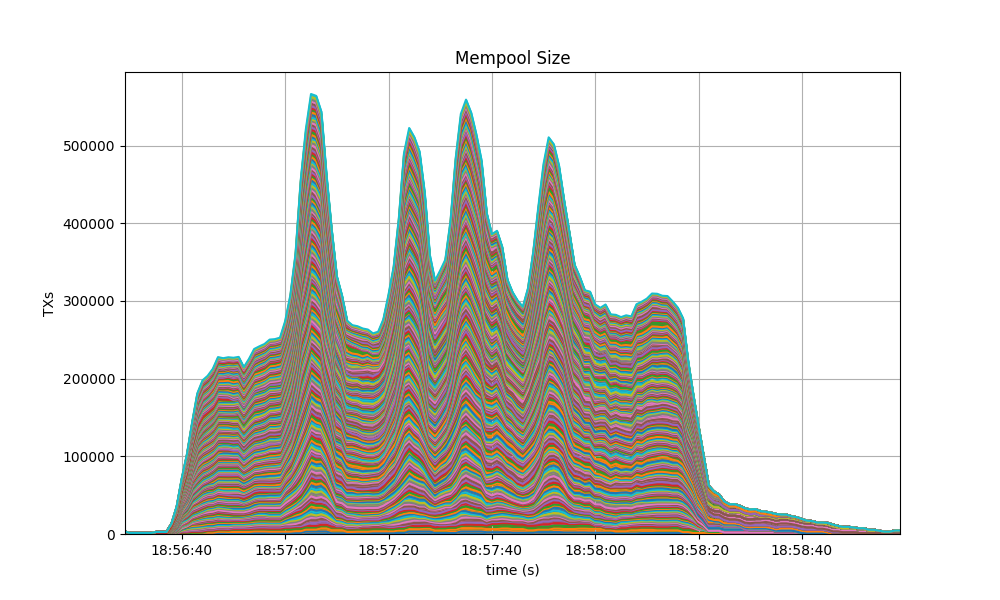
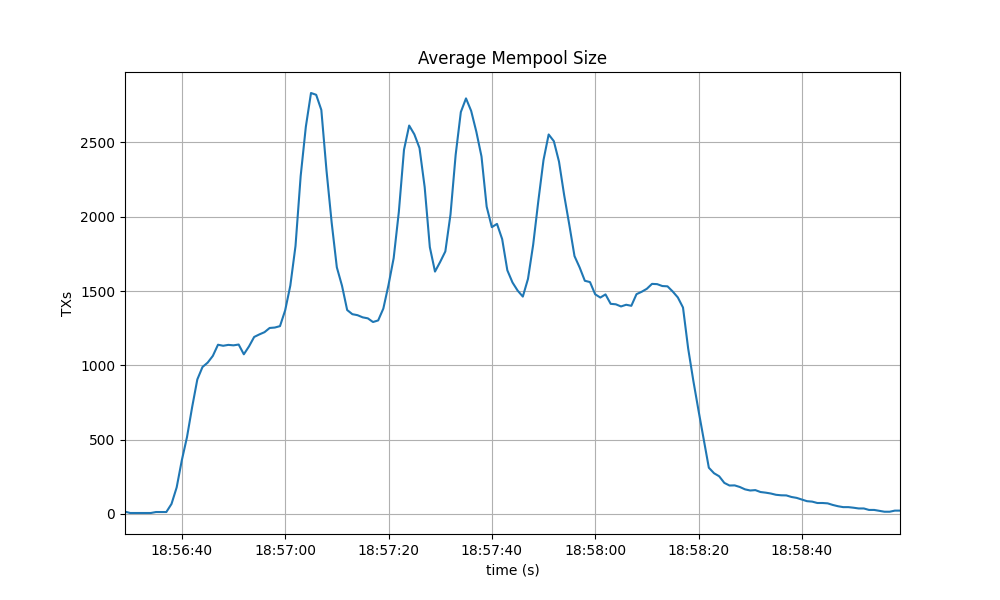
mempool 大小即 mempool 中交易数量的计数,在所有全节点上都表现为稳定且较为一致,没有出现无约束增长。下图展示了在任意时刻所有全节点 mempool 内交易累计数量随时间的变化。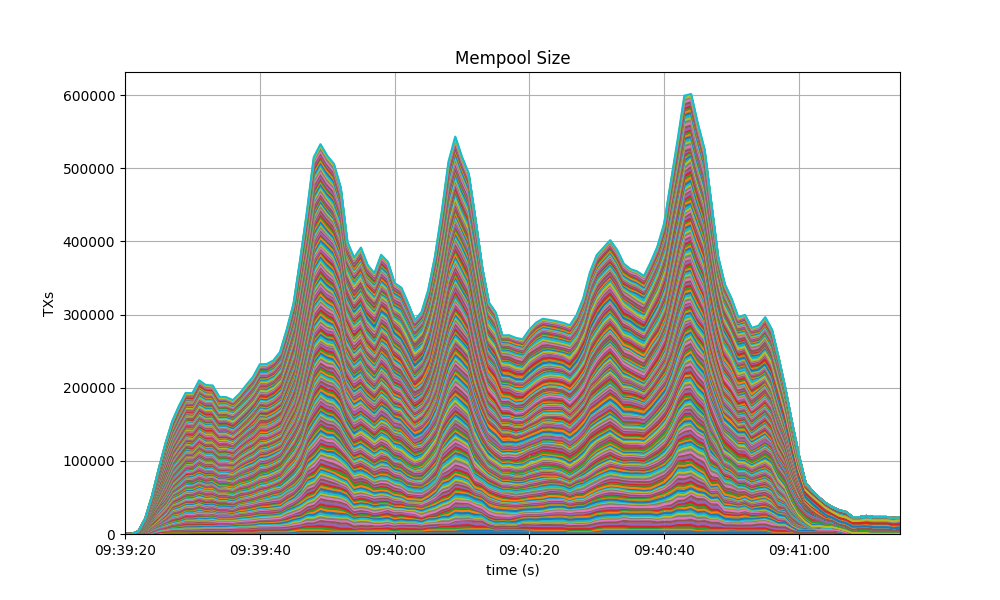 下图展示了所有全节点平均 mempool 大小随时间的变化,大多数时候在 1000 到 2500 笔待处理交易之间波动。
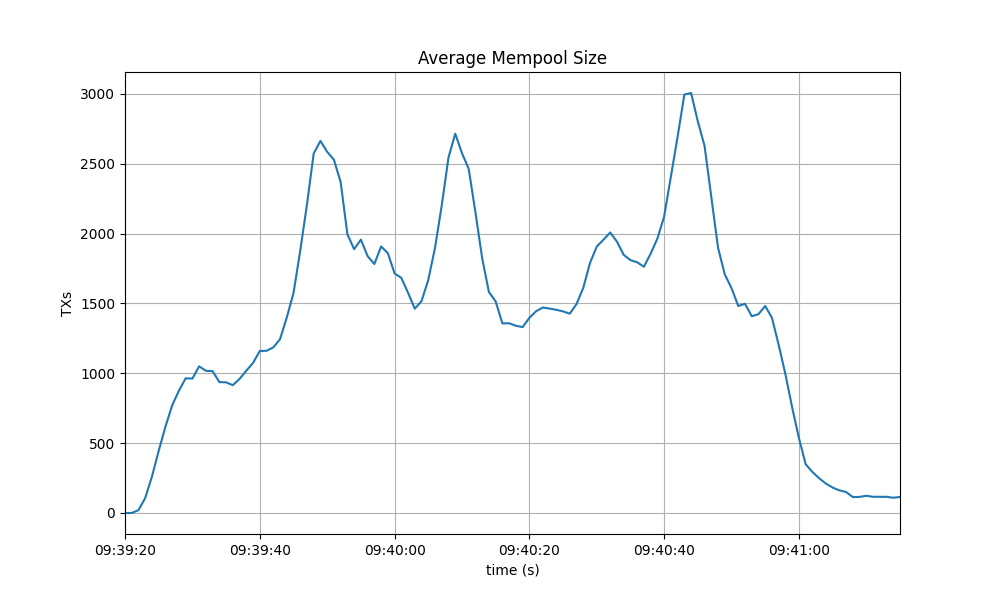 观察到的峰值与部分节点在共识中进入第 1 轮的时刻一致(见下文)。
这种行为与下面展示的基线版本表现相似。
观察到的峰值与部分节点在共识中进入第 1 轮的时刻一致(见下文)。
这种行为与下面展示的基线版本表现相似。
Peer 数量
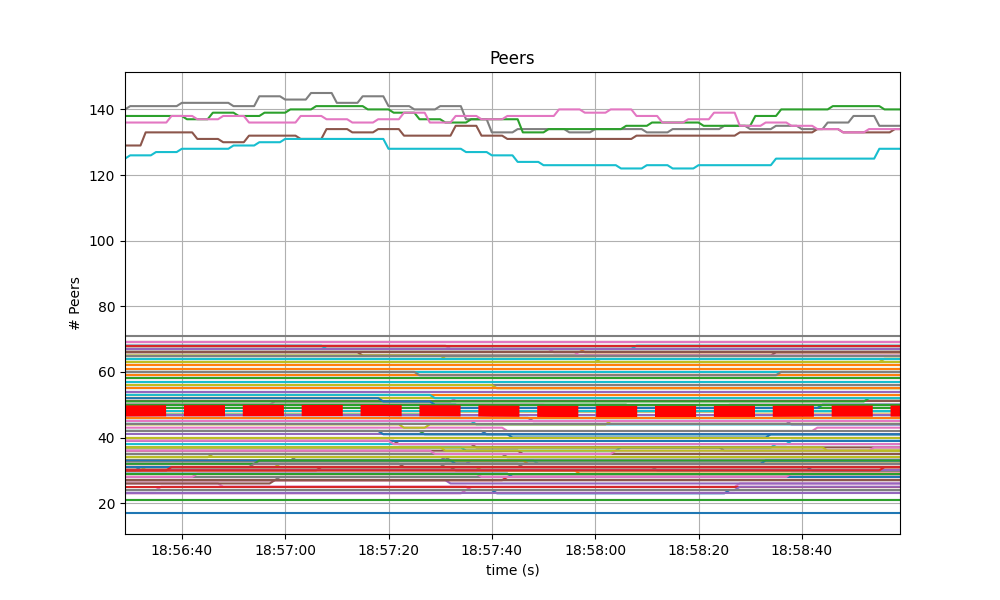
所有节点的 peer 数量都较为稳定。seed 节点的 peer 数量更高(约 140),其余节点则多数介于 20 到 70 之间。红色虚线表示平均值。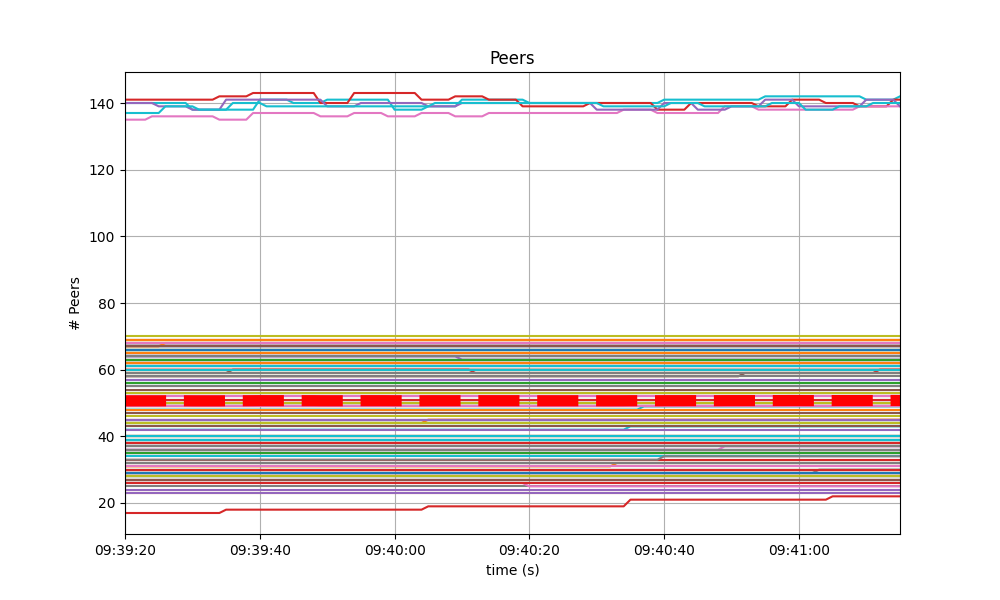 和下面展示的基线版本一样,非 seed 节点会超过 50 个 peer,这一点是由 #9548 导致的。
每个高度的共识轮次
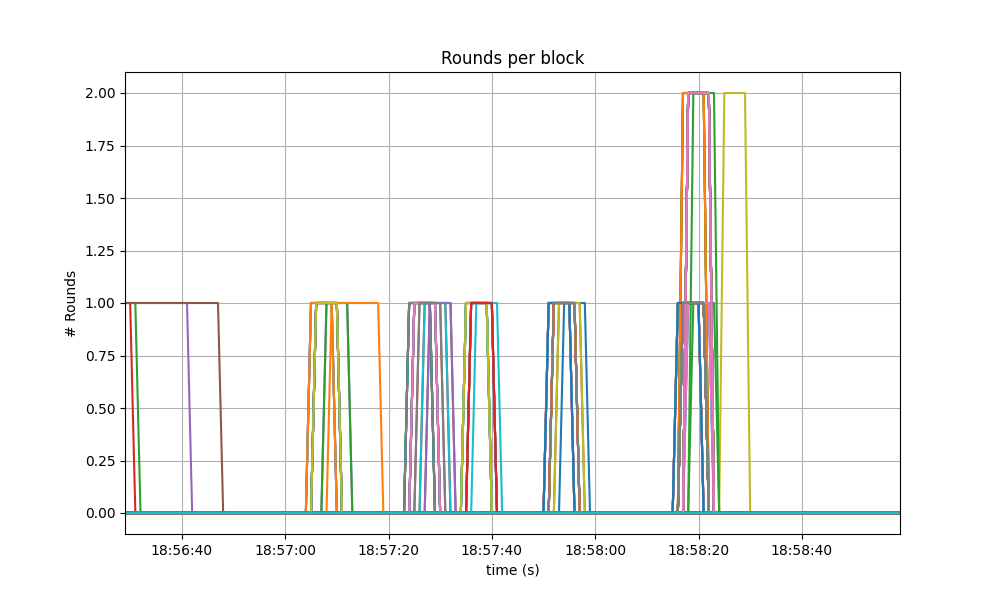
大多数高度只需要一轮,也就是第 0 轮,但也有一些节点需要推进到第 1 轮。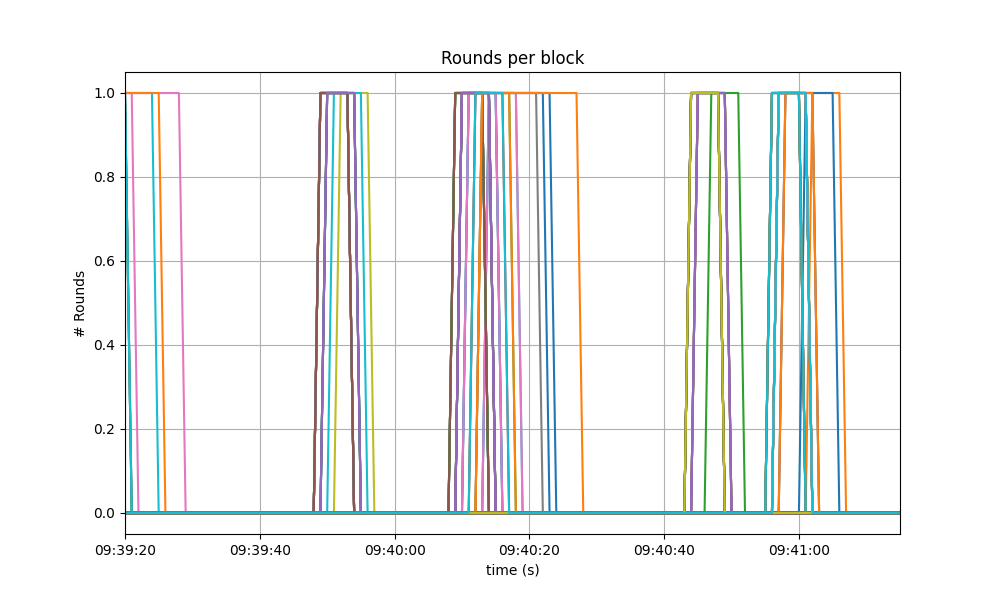 下图所示的这次基线运行中,也有一些节点需要进入第 1 轮。
每分钟产生的区块数、每分钟处理的交易数
下图从每个节点的视角展示了区块创建速率。也就是说,它展示了每个节点何时得知一个新区块已经达成共识。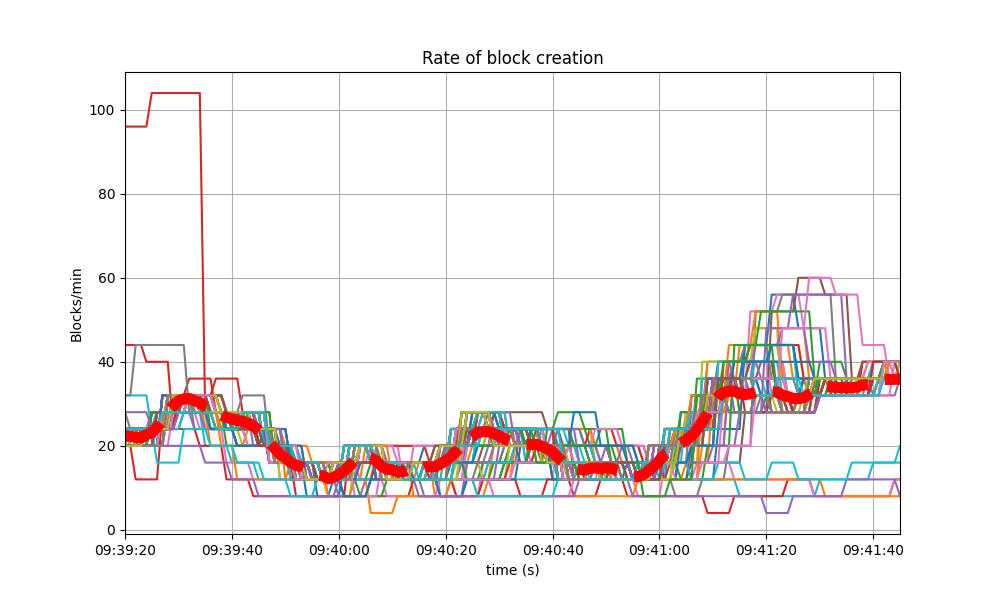 在系统持续承受负载的大部分时间里,大多数节点维持在约 20 个区块/分钟。
超过 100 个区块/分钟的峰值是由于某个较慢节点在追赶进度。
基线版本也表现出类似行为。
在系统持续承受负载的大部分时间里,大多数节点维持在约 20 个区块/分钟。
超过 100 个区块/分钟的峰值是由于某个较慢节点在追赶进度。
基线版本也表现出类似行为。
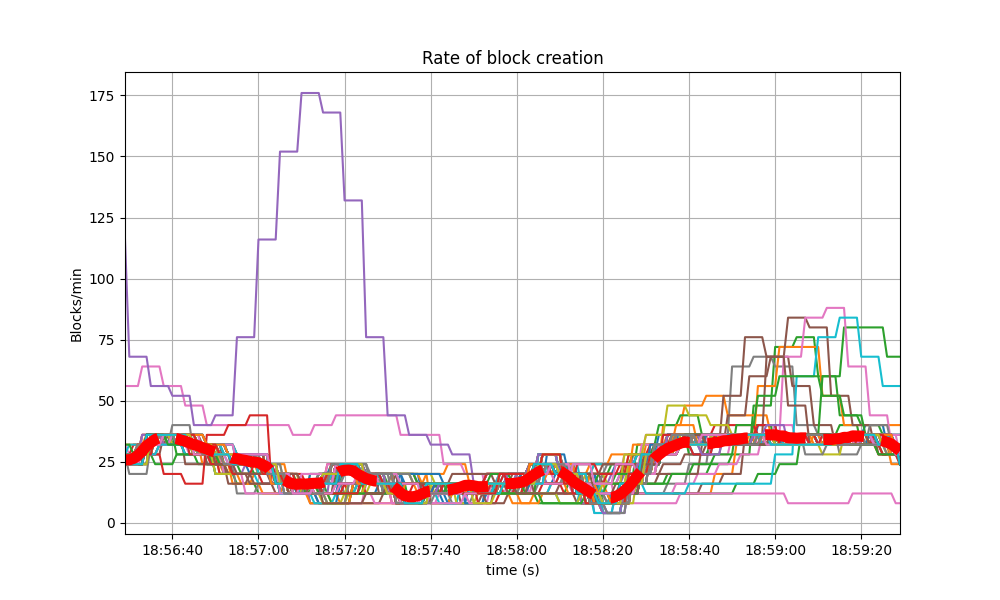 图右侧的集体尖峰标志着负载注入结束,此时区块变得更小(为空),对网络造成的压力也更小。下面展示每分钟处理交易数的图也反映了这一行为。
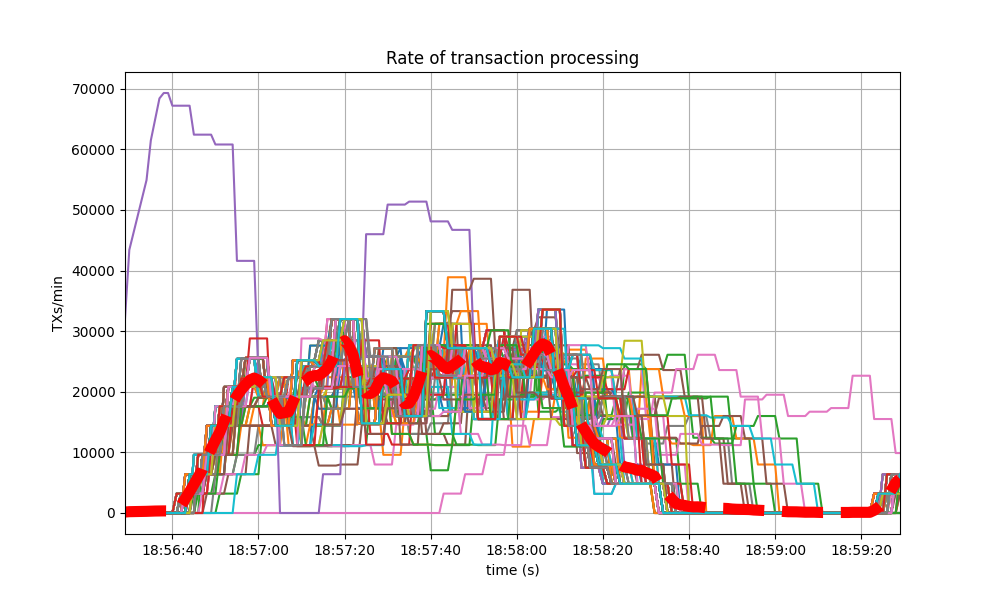
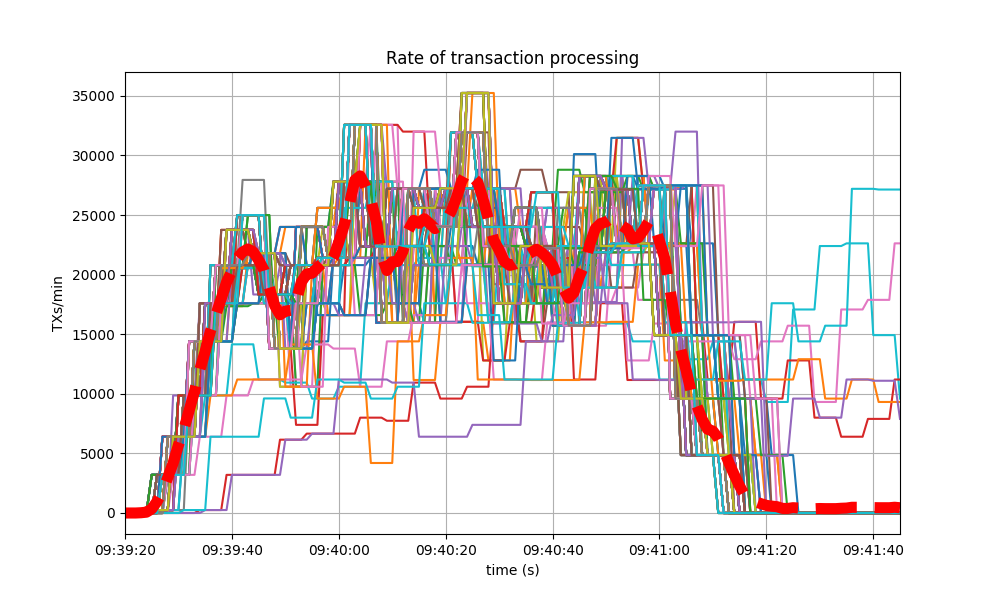 下图展示基线版本的交易处理速率,与上图相似。
常驻内存集大小
下图展示了所有被监控进程的常驻内存集大小(Resident Set Size),最大内存使用为 1.6GB,略低于后面展示的基线版本。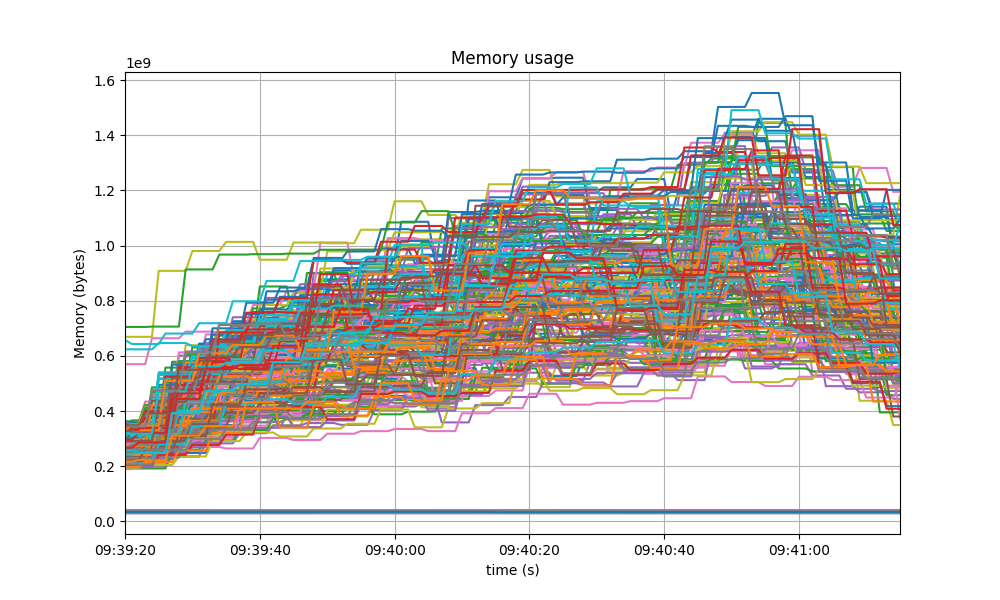 基线版本表现出类似行为,且内存使用甚至略高一些。
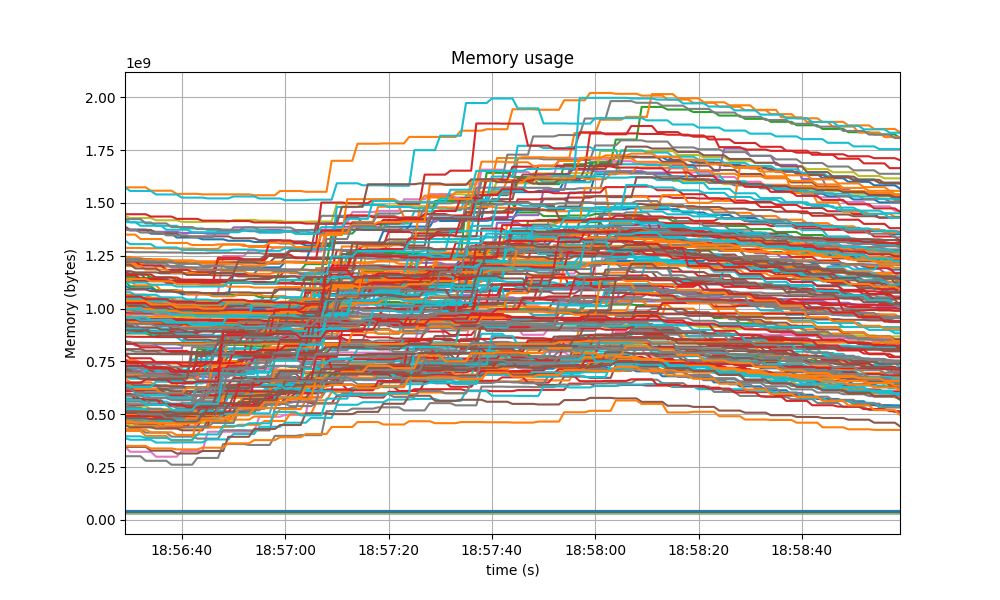 随着负载移除,所有进程的内存都下降了,没有出现无约束增长的迹象。
CPU 利用率
与基线对比
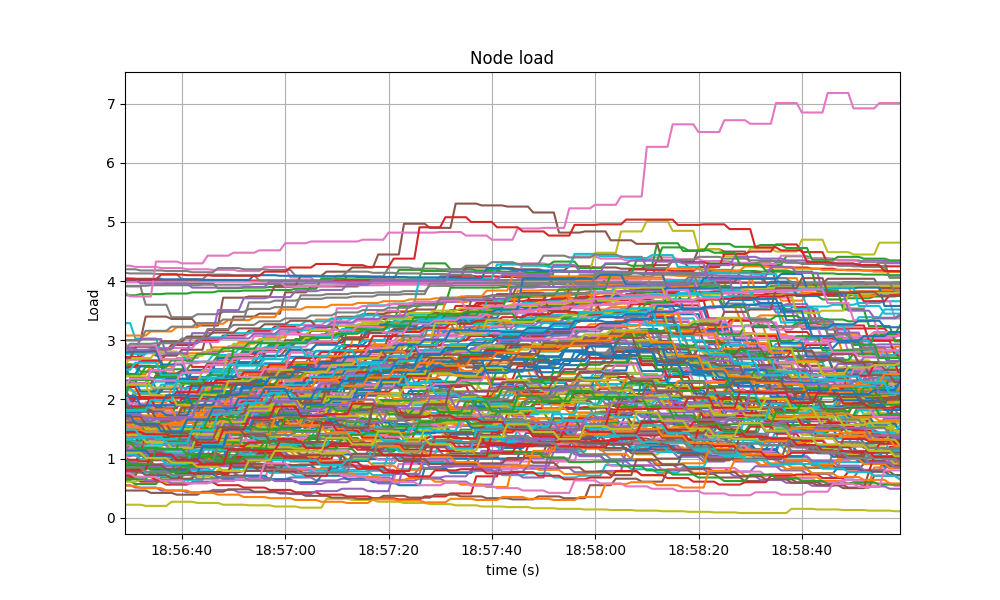
在 Unix 机器上,从 Prometheus 中衡量 CPU 利用率的最佳指标是load1,它通常会出现在top 的输出中。
如下图所示,大多数节点的负载都保持在 5 以下。
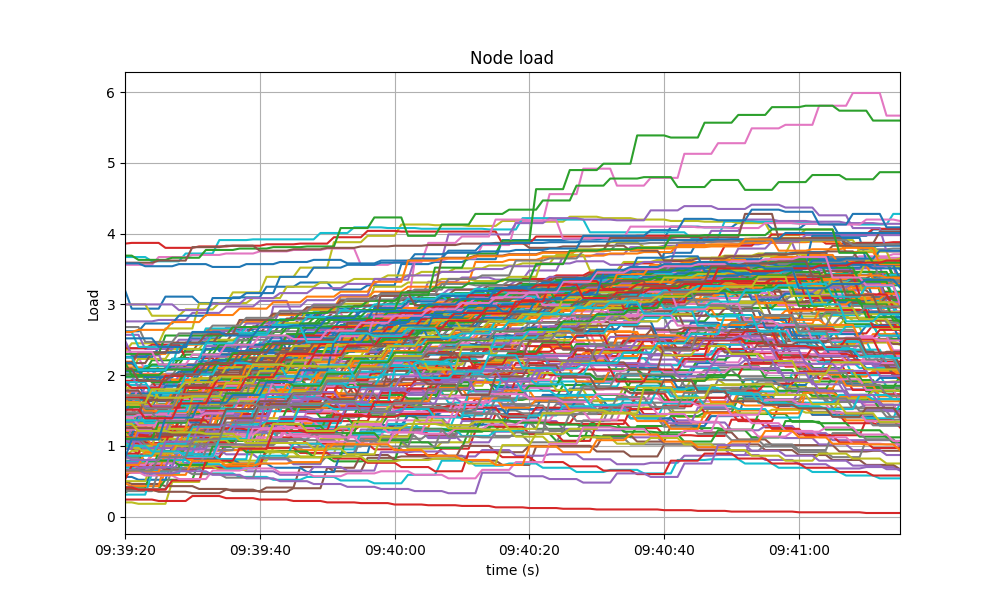 基线版本也有类似表现。
投票扩展签名校验的影响
需要特别指出的是,基线版本(v0.37.x)并未实现投票扩展,而被测版本(v0.38.0-alpha.2)已经实现,并且配置为从高度 1 开始启用。
测试中使用的 e2e 应用会在每个高度对所有接收到的投票扩展签名(最多 175 个)校验两次:一次是在 PrepareProposal 时(用于健全性检查),另一次是在 ProcessProposal 时(用于展示真实应用可以如何执行该校验)。
基线版本与 v0.38.0-alpha.2 的 CPU 利用率图没有明显差异,这意味着在 CometBFT 从网络接收投票扩展时完成初始校验之外,再额外对最多 175 个投票扩展签名执行两次重新校验,在当前系统版本中不会带来性能影响:瓶颈出现在别处。
因此,我们应当将优化重点放在系统的其他部分,也就是导致当前瓶颈的部分(mempool gossip 重复、更加精简的 proposal 结构、优化的 consensus gossip)。
测试结果
与基线结果的比较表明,这两个场景的数值相近,因此可以认为两者等价。 下表给出了这些测试的摘要,以及实验中使用的提交版本。| 场景 | 日期 | 版本 | 结果 |
|---|---|---|---|
| 200 节点 | 2023-05-21 | v0.38.0-alpha.2 (1f524d12996204f8fd9d41aa5aca215f80f06f5e) | 通过 |
轮换节点测试网
我们使用c=1,r=400 作为负载,这可以视为一种安全工作负载,因为它接近 200 节点测试网中的饱和点,但尚未达到。这个测试网的节点更少(10 个验证者和 25 个全节点)。
需要特别说明的是,本节采用的基线版本是 v0.37.0-alpha.2(Tendermint Core),这与上一节使用的基线版本不同。原因是这个测试网并未针对 v0.37.0-alpha.3(CometBFT)重新测试,因为当时认为没有必要。
与基线测试不同,这些测试所使用的 CometBFT 版本不受 #9539 影响;该问题是在 v0.37 的轮换测试网运行结束后立即修复的。
因此,本轮测试引入的负载更高,因为交易不会被拒绝。
延迟
所有延迟的图可见于此。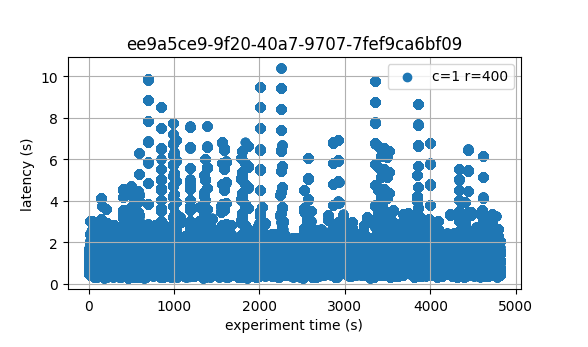 这与基线版本相似。
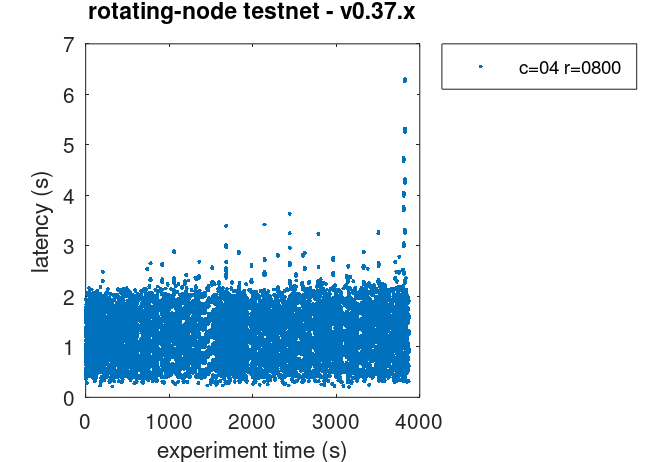 相较于基线版本,平均延迟大约增加了 1 秒,这是因为产生的交易负载更高(请记住,基线版本受 #9539 影响,因此负载发生器生成的大多数交易都会被
 CheckTx 拒绝)。
Prometheus 指标
这里展示的指标集合与相同实验下基线版本(v0.37)展示的指标大致一致。我们也同时给出了基线结果用于对比。
每分钟区块数和交易数
下图展示了每分钟产生的区块数。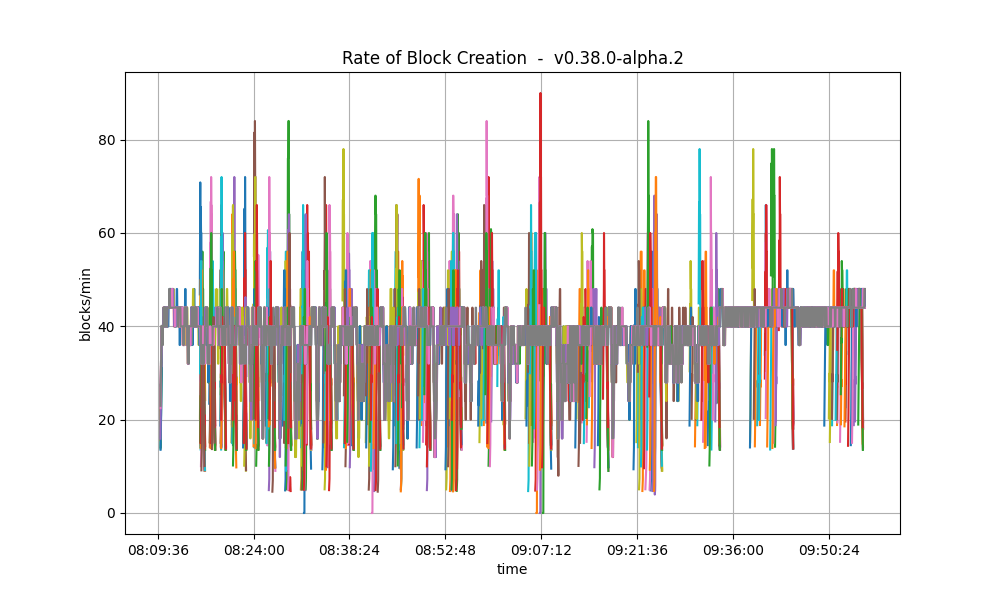 这与下方展示的基线版本相似。
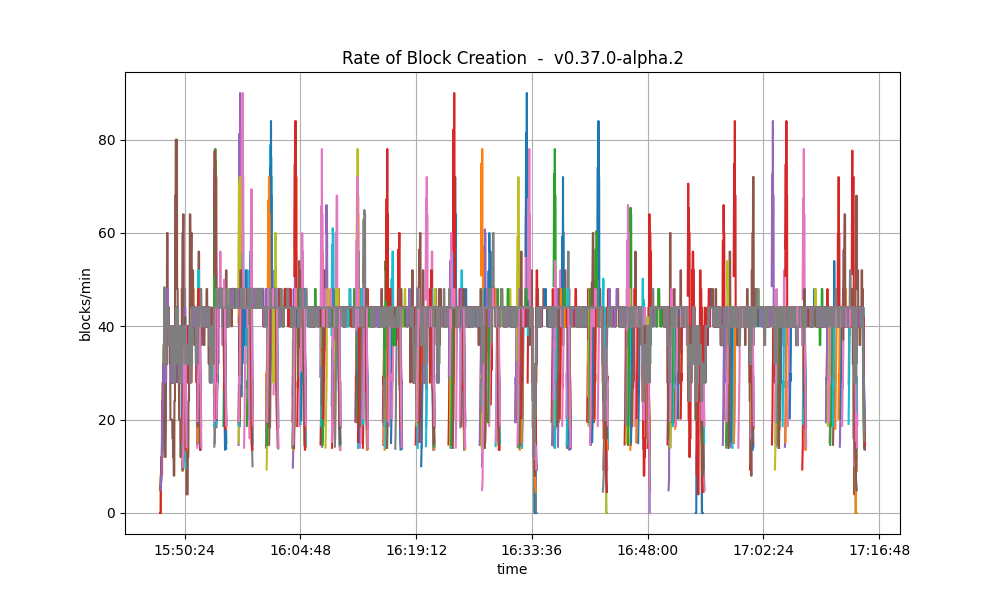 下图仅展示临时节点上报的高度,包括它们在进行 blocksync 和运行 consensus 时的数据。
第二张图是用于对比的基线图。基线图中缺少节点进行 blocksync 时的高度,因为该指标是在之后才实现的。
下图仅展示临时节点上报的高度,包括它们在进行 blocksync 和运行 consensus 时的数据。
第二张图是用于对比的基线图。基线图中缺少节点进行 blocksync 时的高度,因为该指标是在之后才实现的。
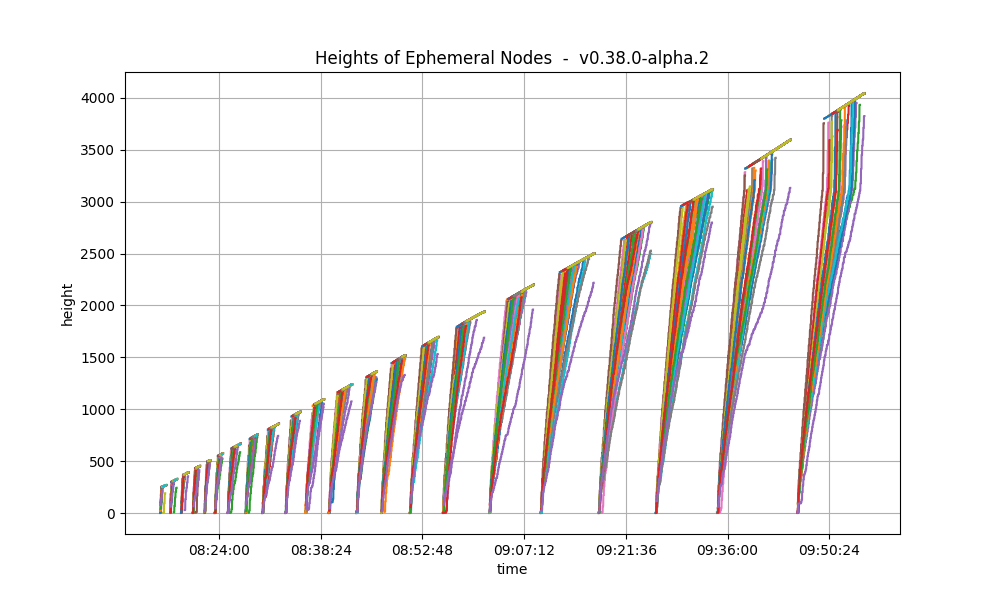
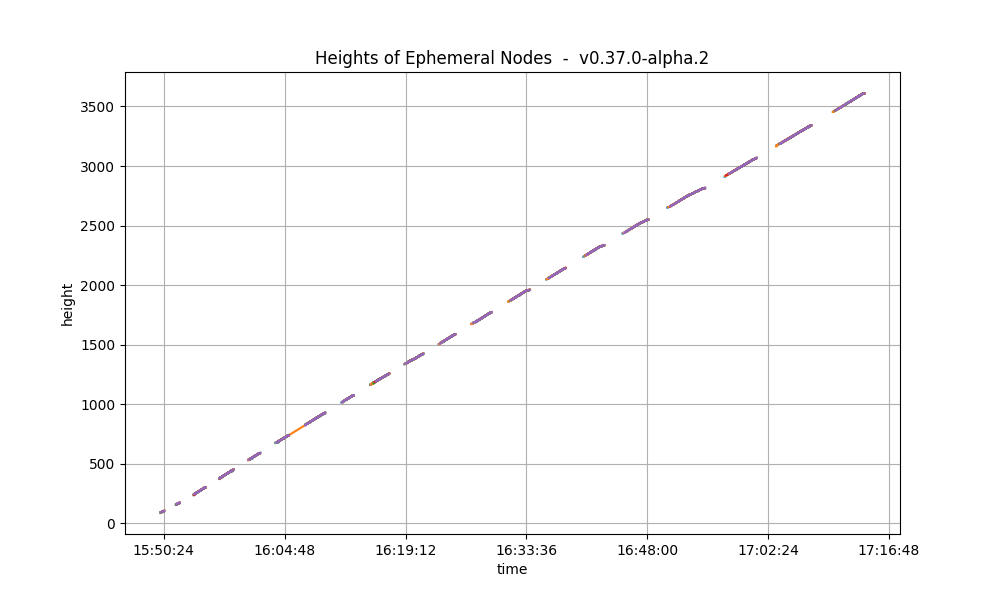 可以看到,两张图中的高度都呈现出相似模式:随着实验推进,其长度不断增长。
下图展示了每分钟处理的交易数。
可以看到,两张图中的高度都呈现出相似模式:随着实验推进,其长度不断增长。
下图展示了每分钟处理的交易数。
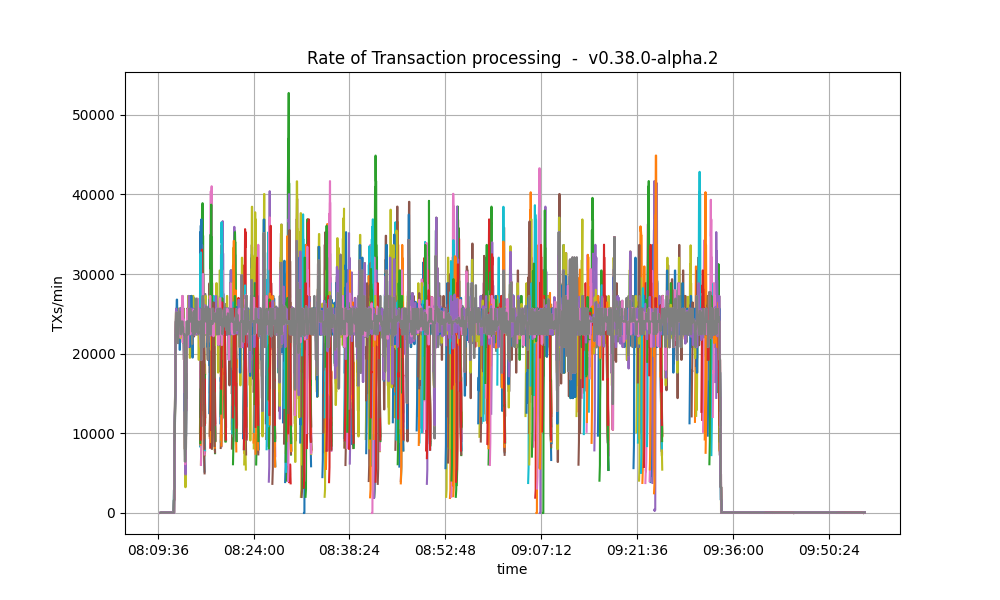 作为对比,下图是基线版本的结果。
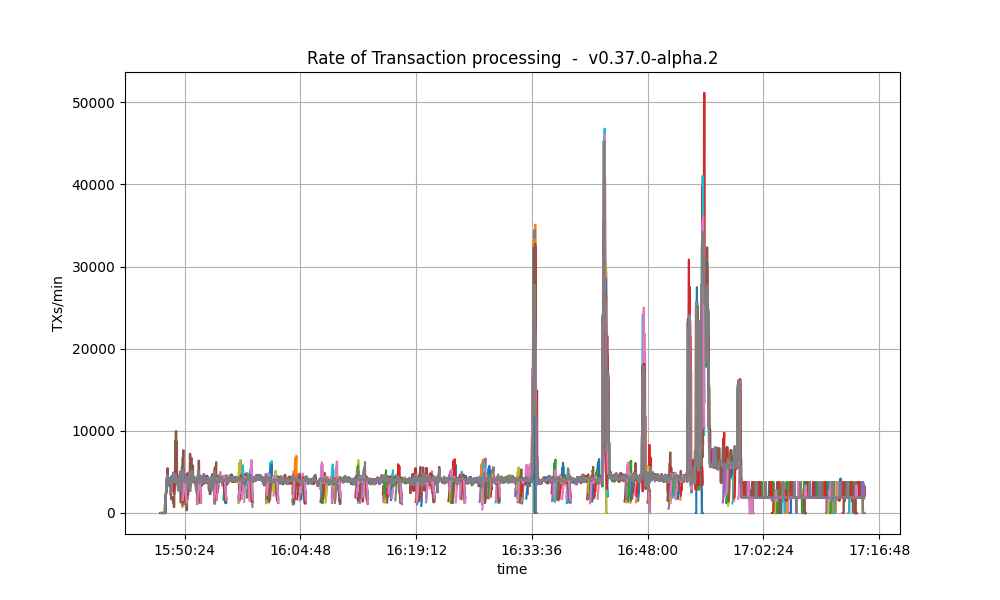 可以看到,基线图中的速率要低得多。
原因在于基线版本受 #9539 影响,导致
可以看到,基线图中的速率要低得多。
原因在于基线版本受 #9539 影响,导致 CheckTx 拒绝了负载发生器生成的大多数交易。
Peer 数量
下图展示了整个实验过程中 peer 数量的变化。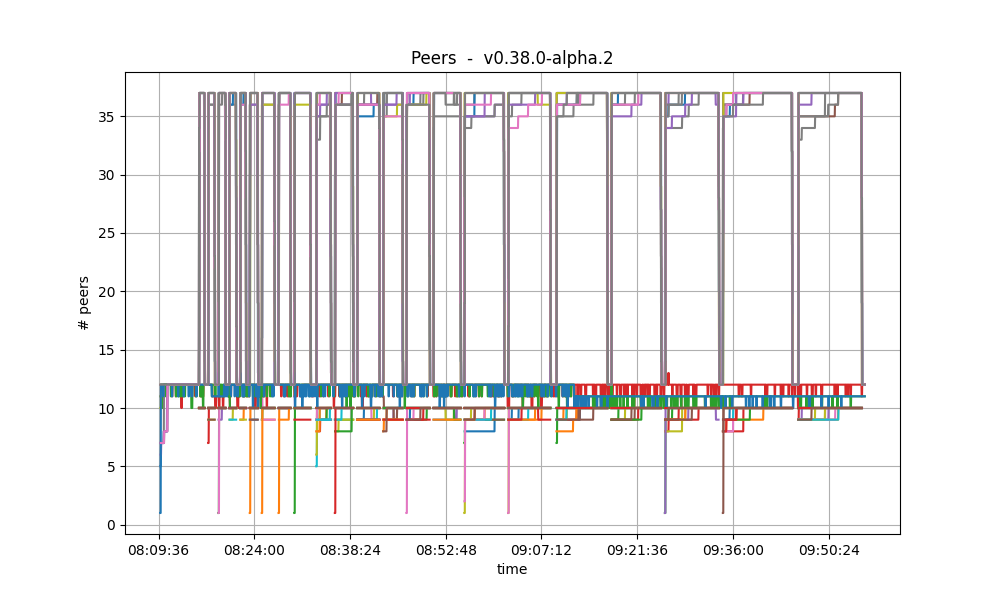 这是用于对比的基线图。
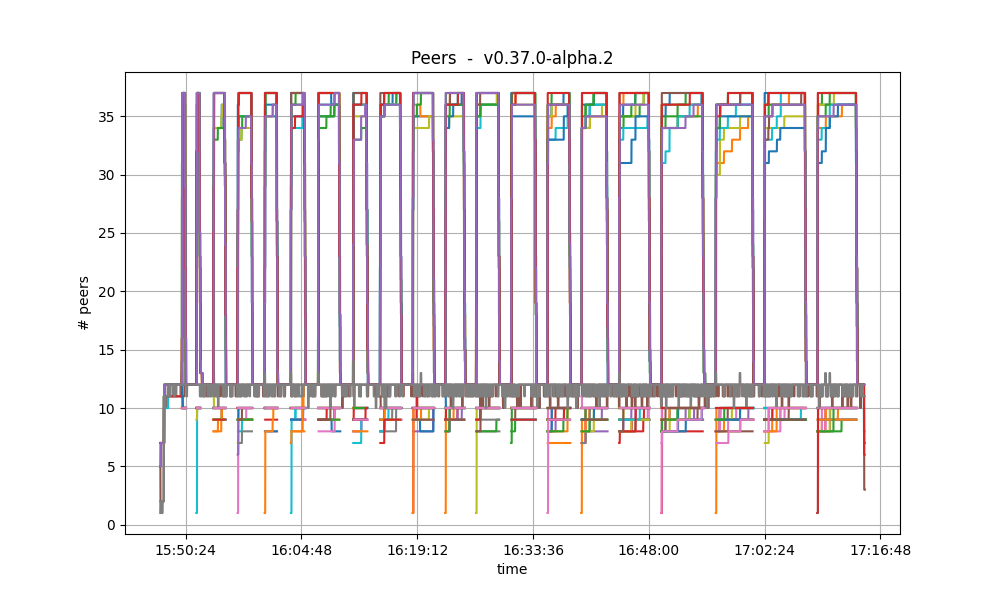 两张图中的数值及其变化趋势具有可比性。
有关这些图的更多细节,请参见本节。
两张图中的数值及其变化趋势具有可比性。
有关这些图的更多细节,请参见本节。
常驻内存集大小
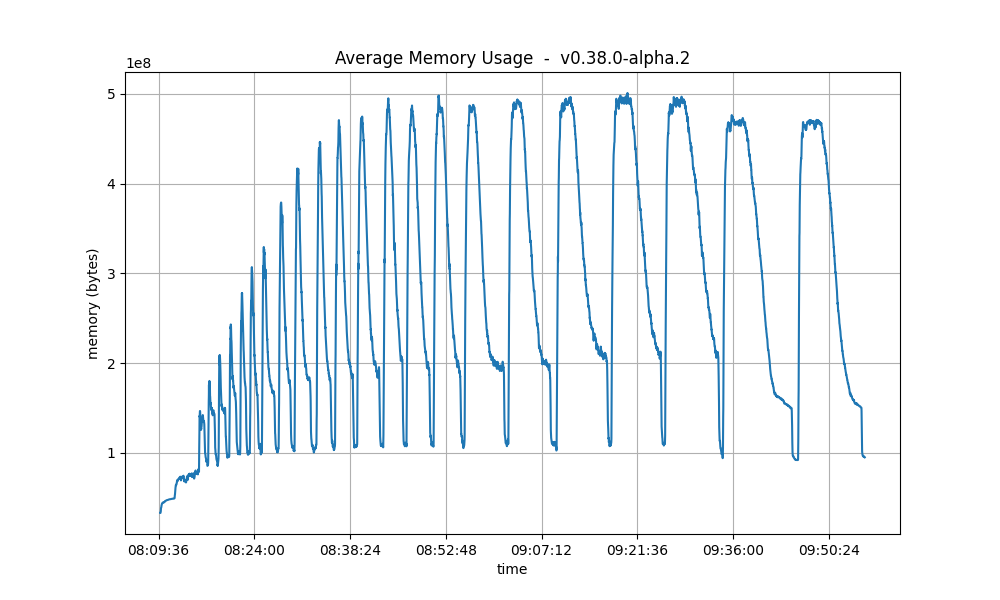
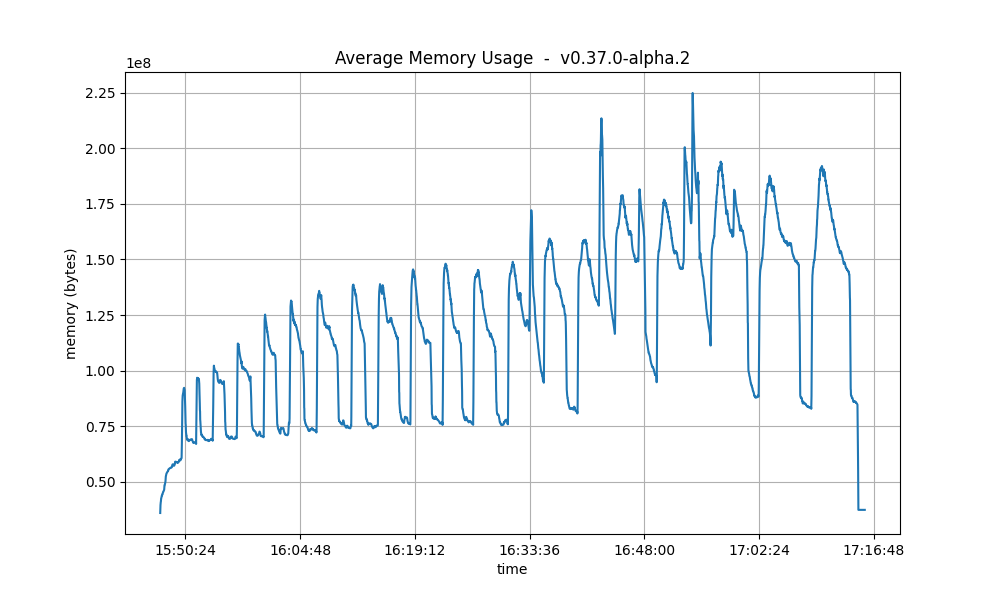
在v0.38.0-alpha.2 上,所有进程的平均常驻内存集大小(RSS)明显高于基线版本。
其原因同样是,基线版本中的 CheckTx 拒绝了大多数已提交交易,因此基线上的整体交易负载更低。
这一点与上一节中交易速率图所显示的差异是一致的。
CPU 利用率
下图展示了v0.38.0-alpha.2 和基线版本中所有节点的 load1 指标。
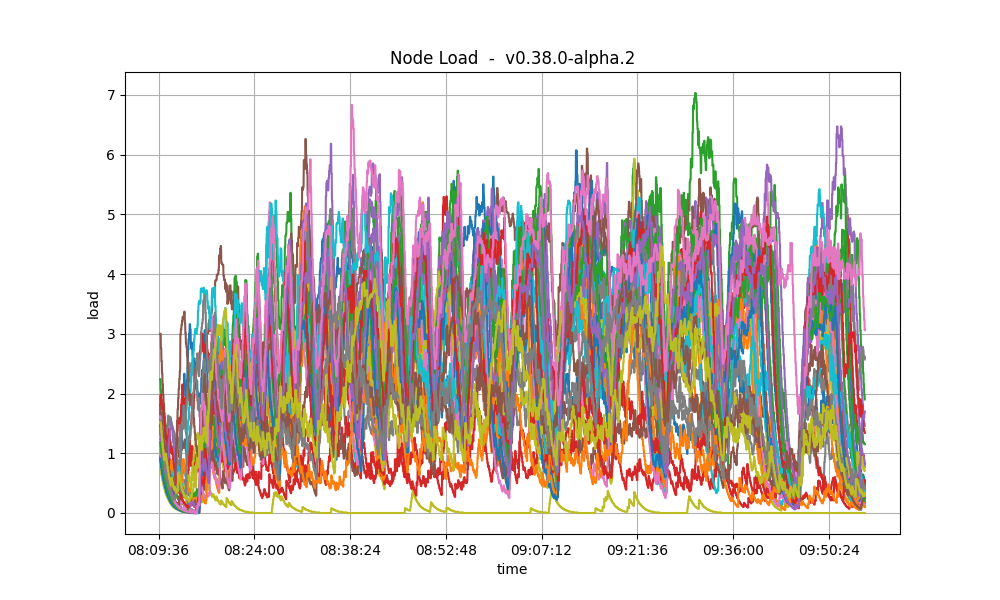
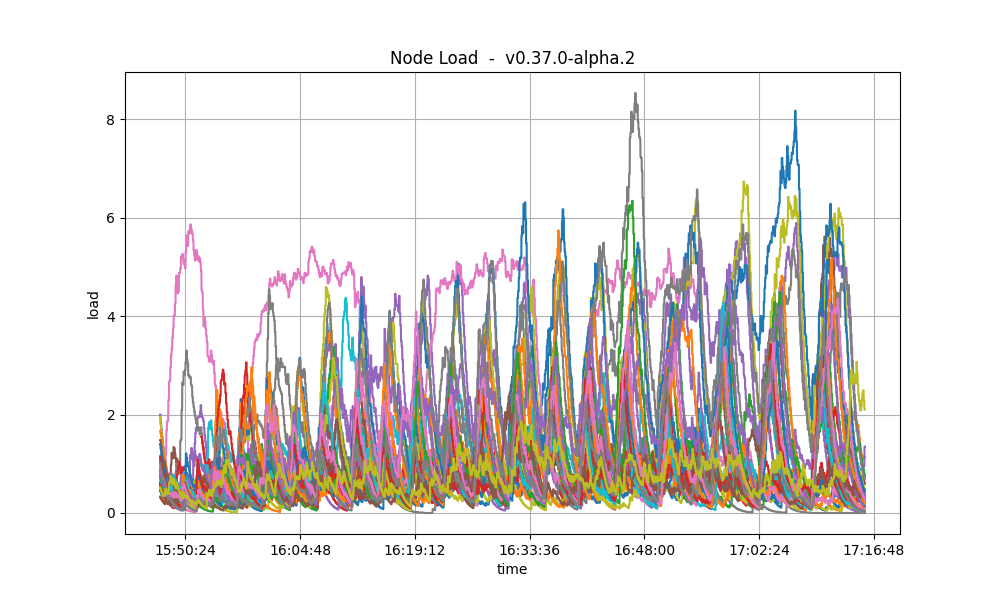 在这两种情况下,大多数时间都保持在 5 以下,这被视为正常负载。
v0.38.0-alpha.2 的平均负载看起来更高一些,因为与基线相比,它每分钟处理的交易数量更多。
测试结果
| 场景 | 日期 | 版本 | 结果 |
|---|---|---|---|
| 轮换 | 2023-05-23 | v0.38.0-alpha.2 (e9abb116e29beb830cf111b824c8e2174d538838) | 通过 |
投票扩展测试平台
在这个测试网中,我们评估向 pre-commit 投票添加不同大小的投票扩展,对 CometBFT 性能造成的影响。 该测试使用我们端到端测试框架中的键值存储,其简化流程如下:- 当验证者为高度 的区块发送 pre-commit 投票时,它们首先会在
ExtendVote中按需扩展投票。 - 当高度 的 proposer 创建待提议区块时,它会在
PrepareProposal中在交易列表前插入一笔特殊交易,用于修改一个保留键。该交易的值来源于高度 的扩展;在这个示例中,该值来源于投票扩展,并包含扩展集合本身,且以十六进制字符串形式编码。 - 当验证者为高度 上提议的区块发送 pre-vote 时,它们会先在
ProcessProposal中再次检查区块中的这笔特殊交易是否由 proposer 正确构建。 - 当验证者为高度 上提议的区块发送 pre-commit 时,它们会先扩展投票,然后在高度 及之后重复这些步骤。
vote_extension_size 生成的随机字节序列。
因此,网络上会观察到两个效果。
首先,pre-commit 投票消息大小会增加指定的 vote_extension_size;其次,由于扩展采用十六进制编码,区块消息大小会增加两倍的 vote_extension_size,再乘以接收到的扩展数量,也就是至少 175 的 2/3。
所有测试都在提交 d5baba237ab3a04c1fd4a7b10927ba2e6a2aab27 上执行,该提交对应于 v0.38.0-alpha.2,并额外包含一些提交,用于为测试应用增加可变投票扩展大小的能力。
尽管基线也使用相同提交,但在该配置下,观察到的行为与原生 v0.38.0-alpha.2 测试应用相同,也就是说,投票扩展是 8 字节整数,并以变长整数压缩编码,而不是大小为 vote_extension_size 的随机序列。
下表汇总了测试用例。
| 名称 | 扩展大小(字节) | 日期 |
|---|---|---|
| 基线 | 8 (varint) | 2023-05-26 |
| 2k | 2048 | 2023-05-29 |
| 4k | 4094 | 2023-05-29 |
| 8k | 8192 | 2023-05-26 |
| 16k | 16384 | 2023-05-26 |
| 32k | 32768 | 2023-05-26 |
延迟
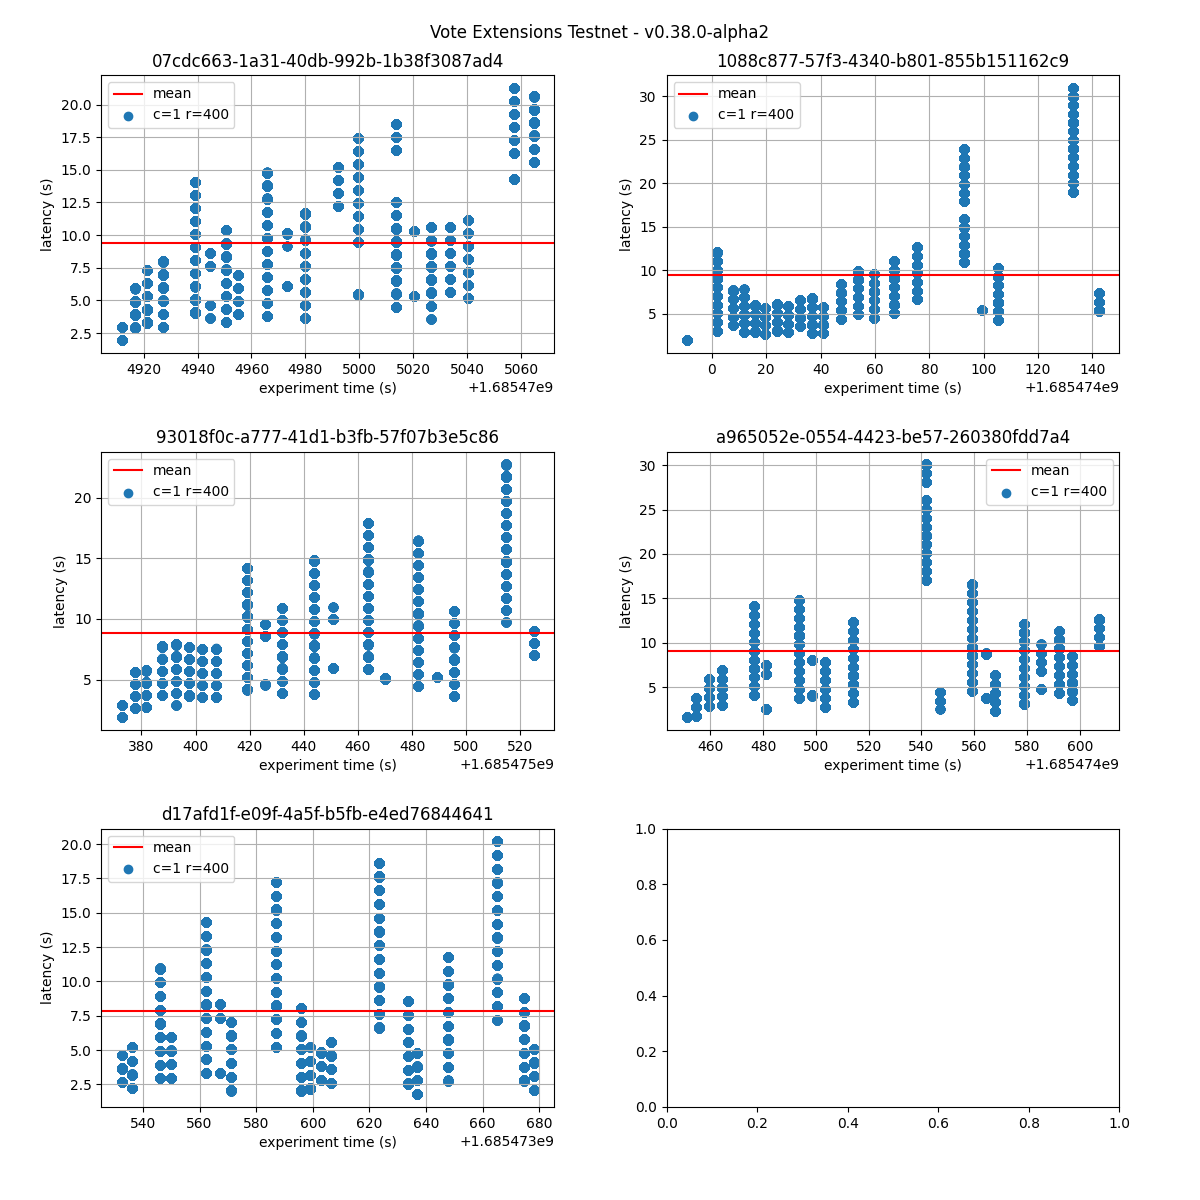
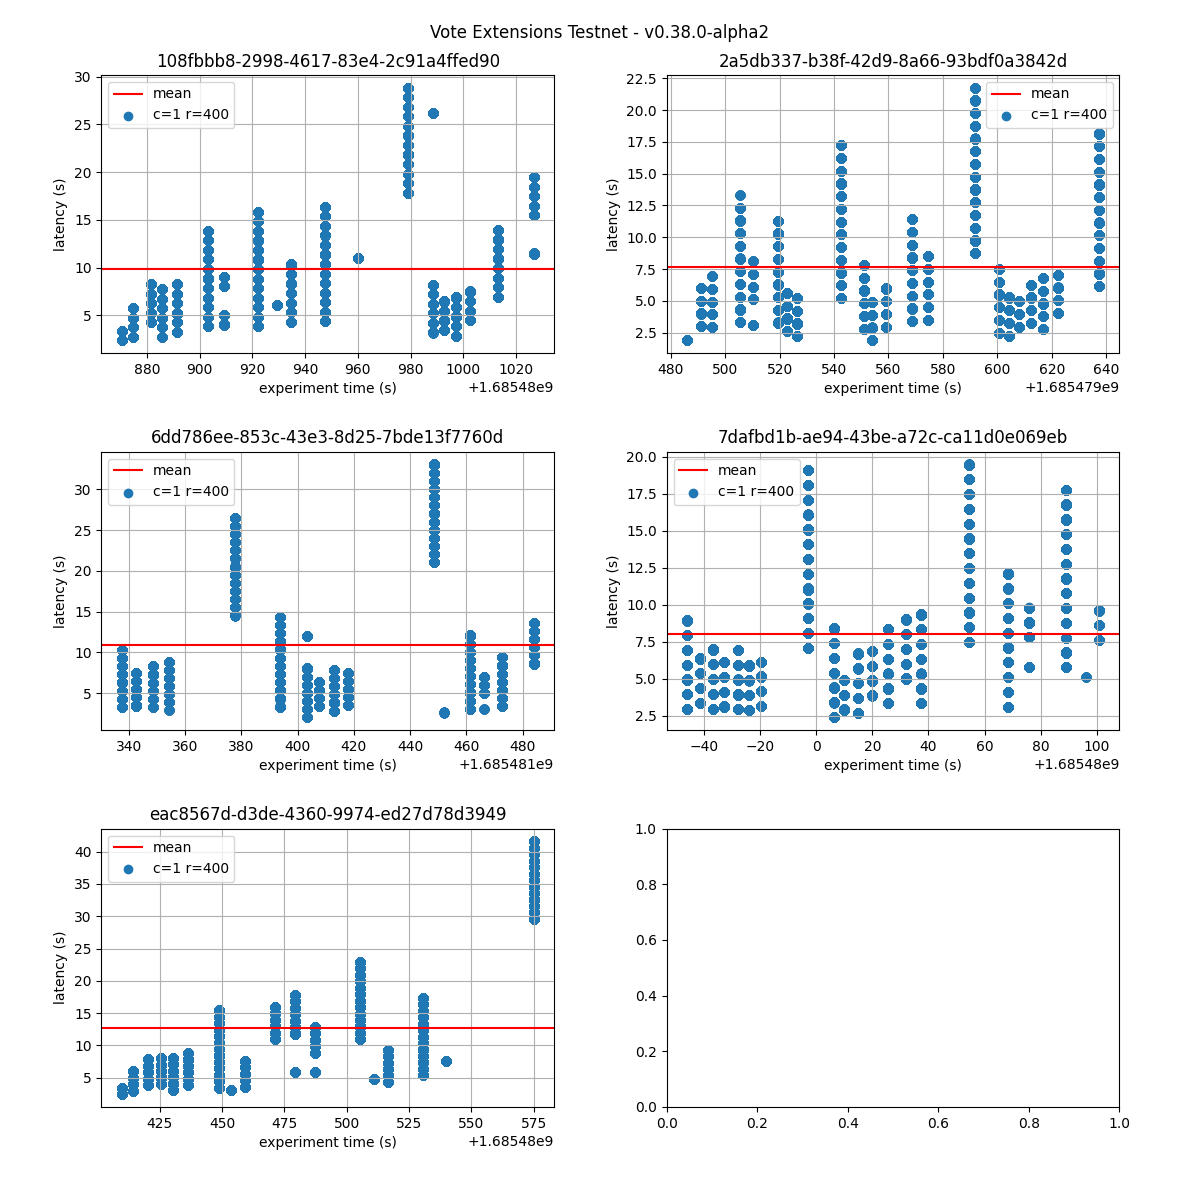
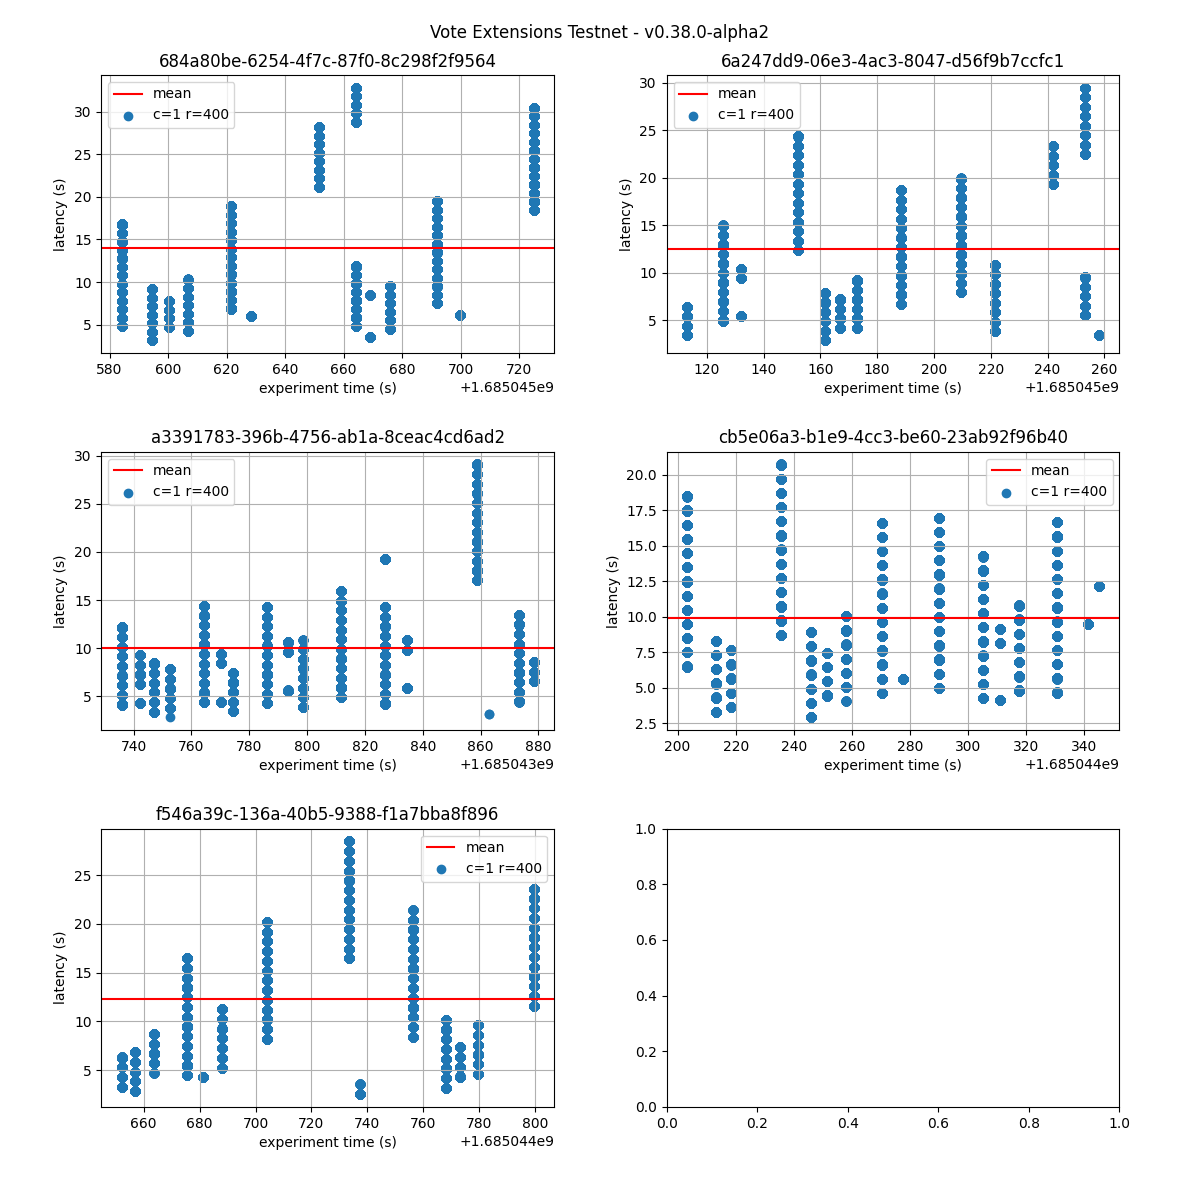
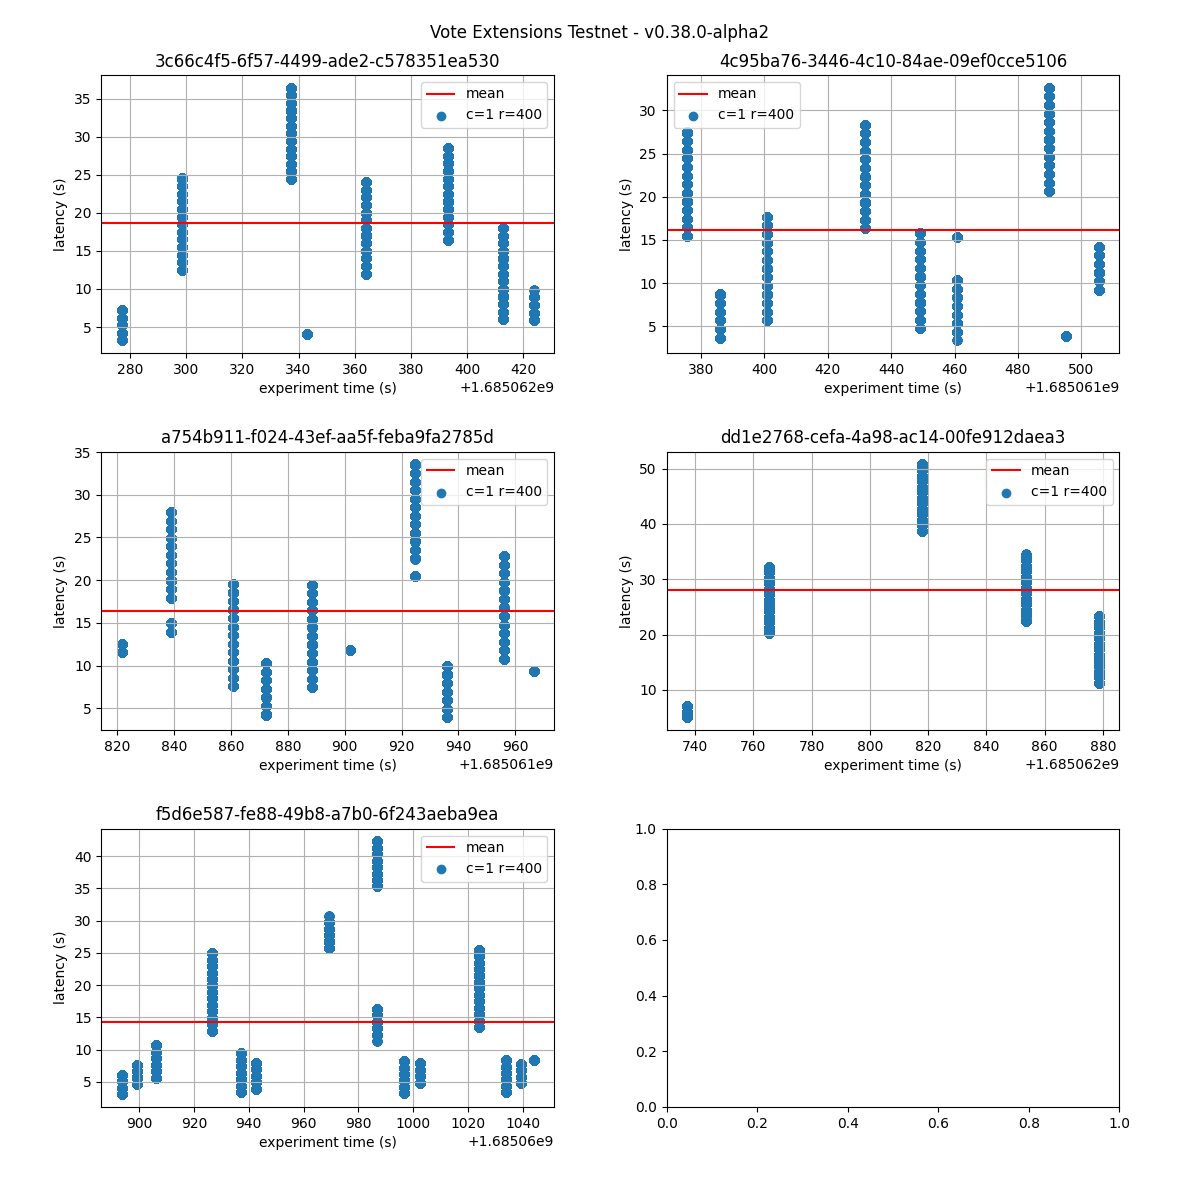
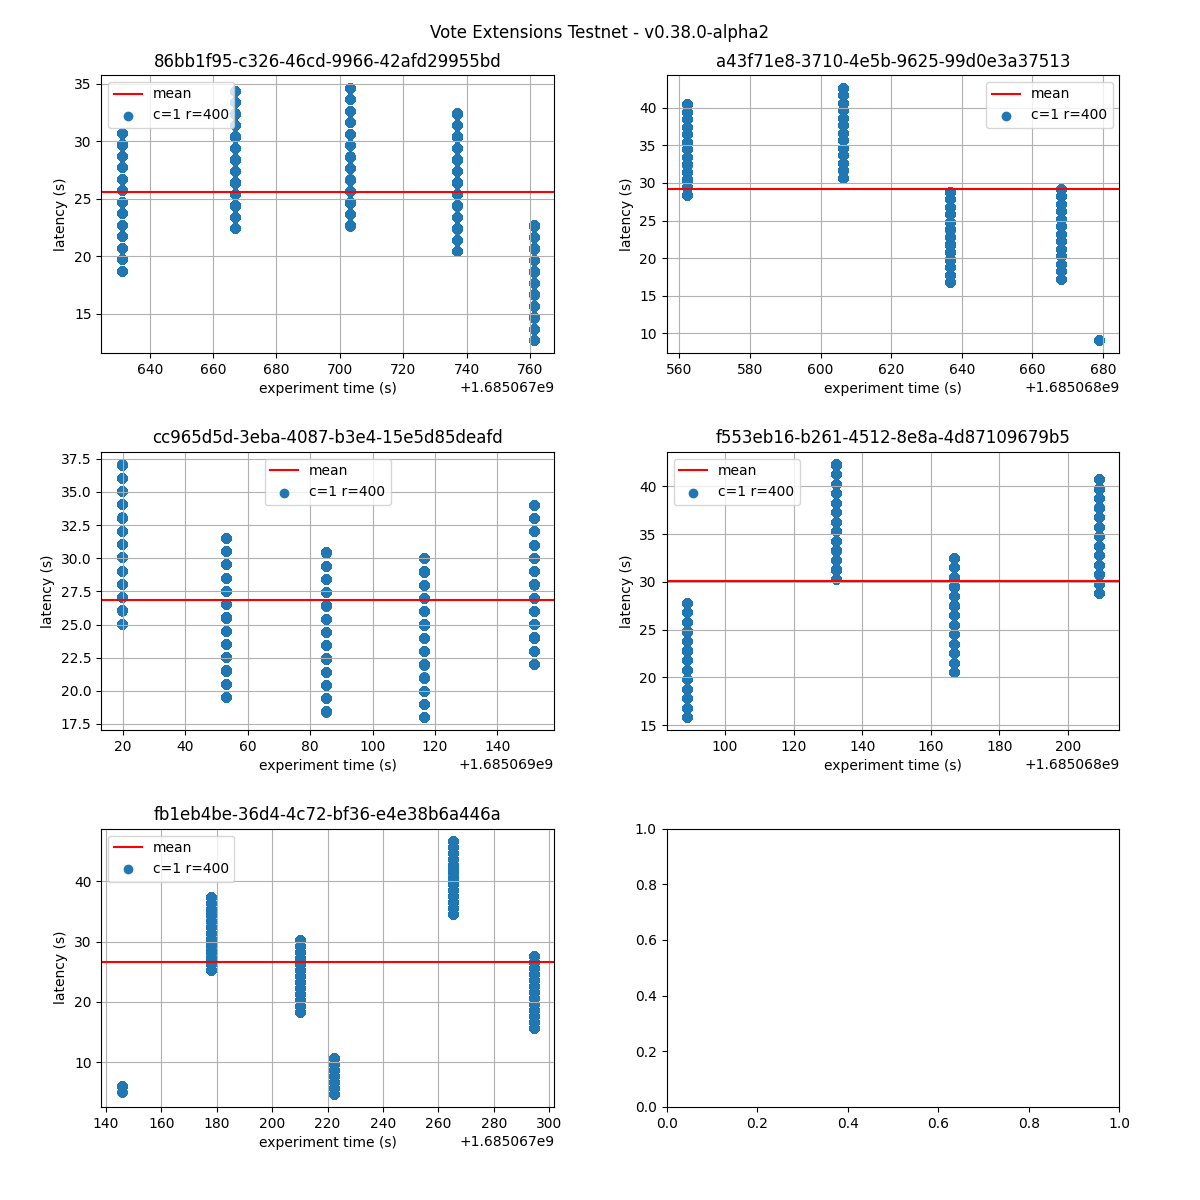
下图展示了每个实验 5 次运行中观察到的延迟;红线表示每次运行的平均值。 从这些图中可以很容易看出,投票扩展越大,延迟波动越明显,高延迟出现得也越频繁。 即便是在 2k 扩展大小的情况下,平均延迟也会从低于 5 秒上升到接近 10 秒。 基线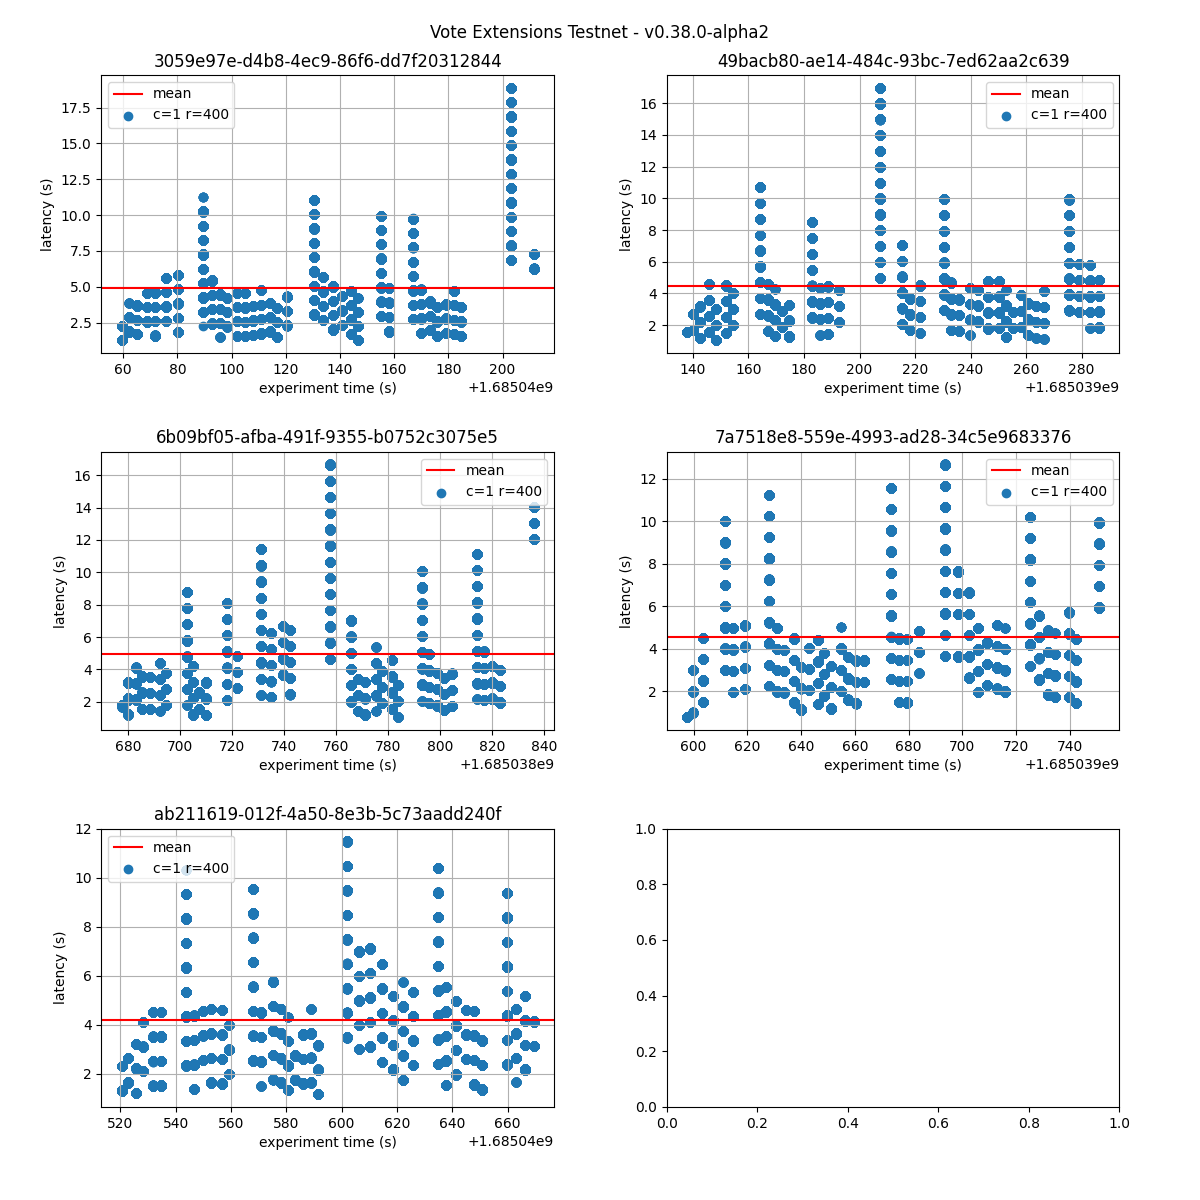 2k
2k
 4k
4k
 8k
8k
 16k
16k
 32k
32k
 下列图表将同一实验的所有运行合并展示。
它们表明,随着投票扩展变大,延迟波动显著增加。
特别是在 16k 和 32k 情况下,系统会出现较长时间没有交易交付的间隔。
如后文所述,这是因为某些高度需要经过多轮才能完成,而新交易会被暂存,直到下一个区块达成共识。
下列图表将同一实验的所有运行合并展示。
它们表明,随着投票扩展变大,延迟波动显著增加。
特别是在 16k 和 32k 情况下,系统会出现较长时间没有交易交付的间隔。
如后文所述,这是因为某些高度需要经过多轮才能完成,而新交易会被暂存,直到下一个区块达成共识。
基线 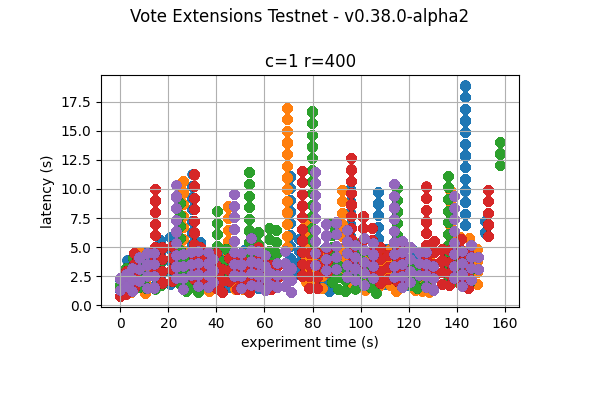 | 2k 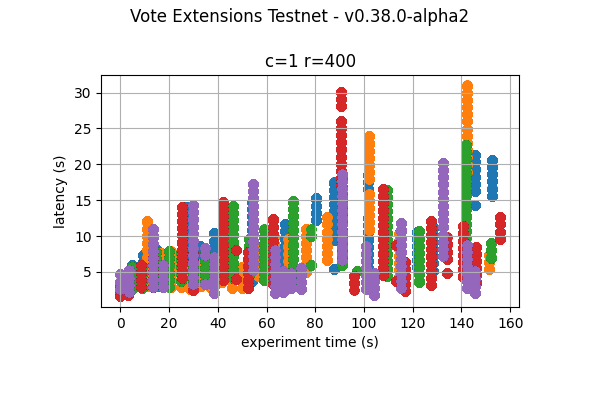 |
4k 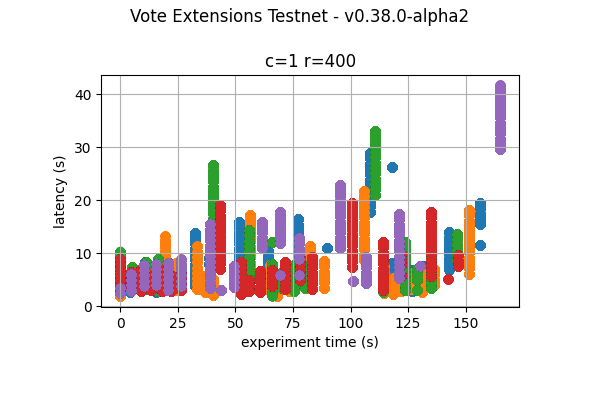 | 8k 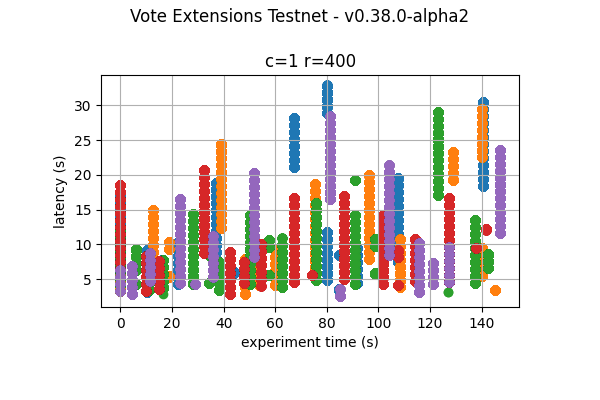 |
16k 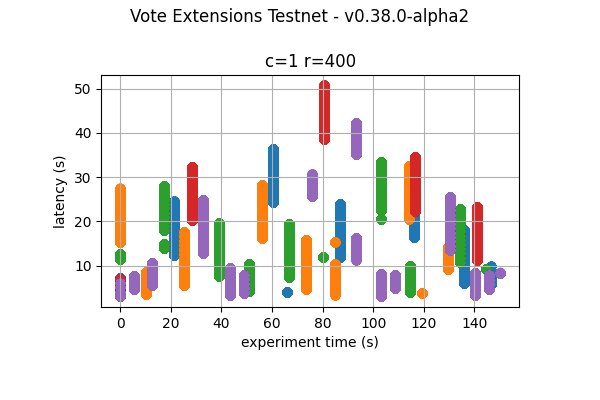 | 32k 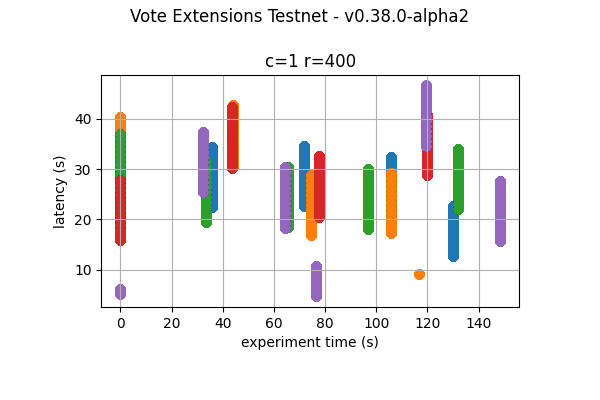 |
每分钟区块数和交易数
下列图表展示了每分钟产生的区块数和每分钟处理的交易数。 我们将展示分为总览部分和详细样本部分:总览部分展示整个实验(五次运行)的指标,详细样本部分展示五次运行中第一次的指标。 对于其他指标,我们也采用相同方式。 红色虚线表示 20 秒窗口上的移动平均值。总览
从总览图中可以清楚看出,随着投票扩展大小增加,区块创建速率会下降。 尽管交易处理速率也在下降,但看起来下降速度没有区块创建速率那么快。| 实验 | 区块创建速率 | 交易速率 |
|---|---|---|
| 基线 | 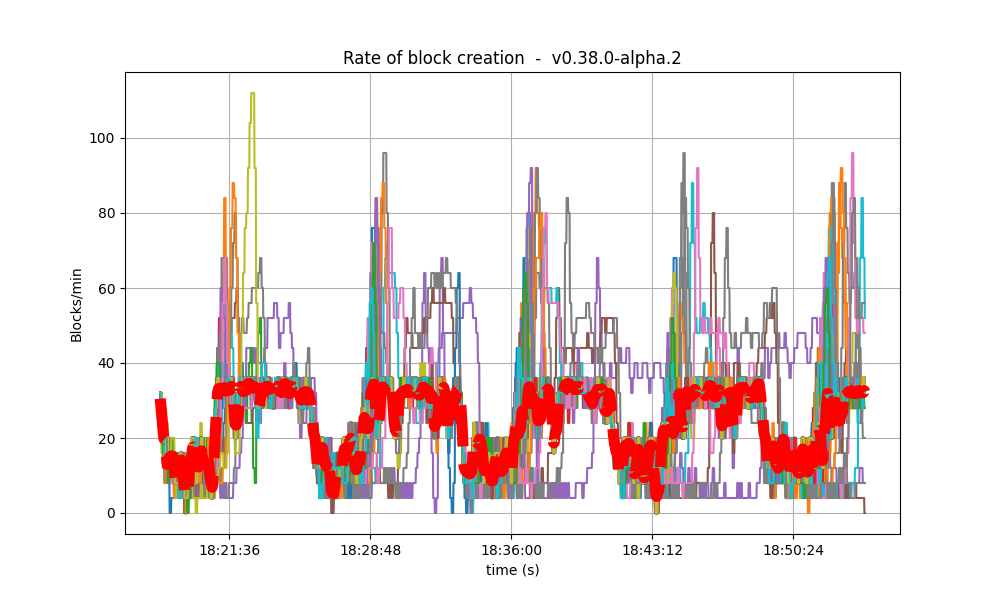 | 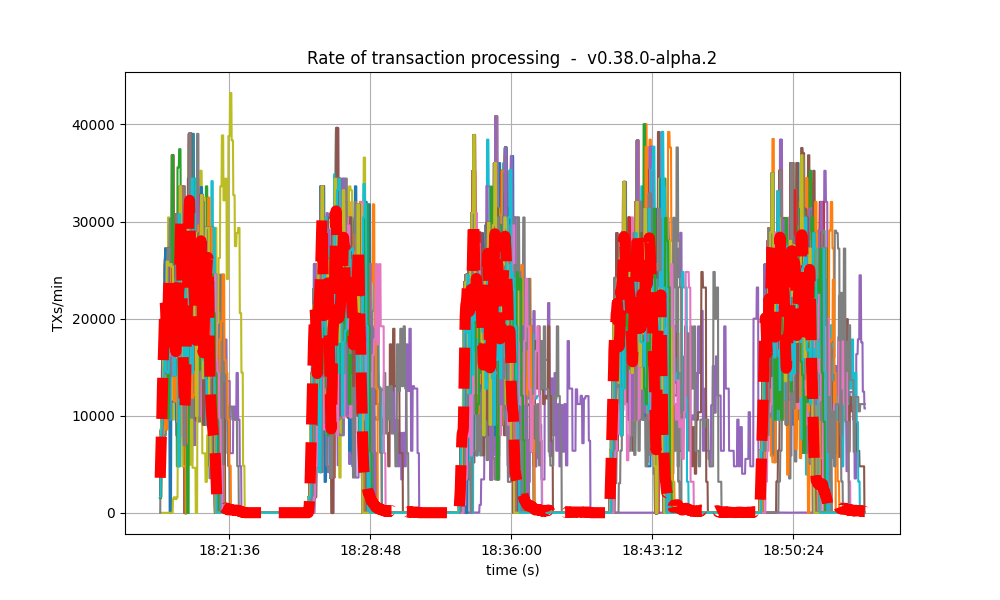 |
| 2k | 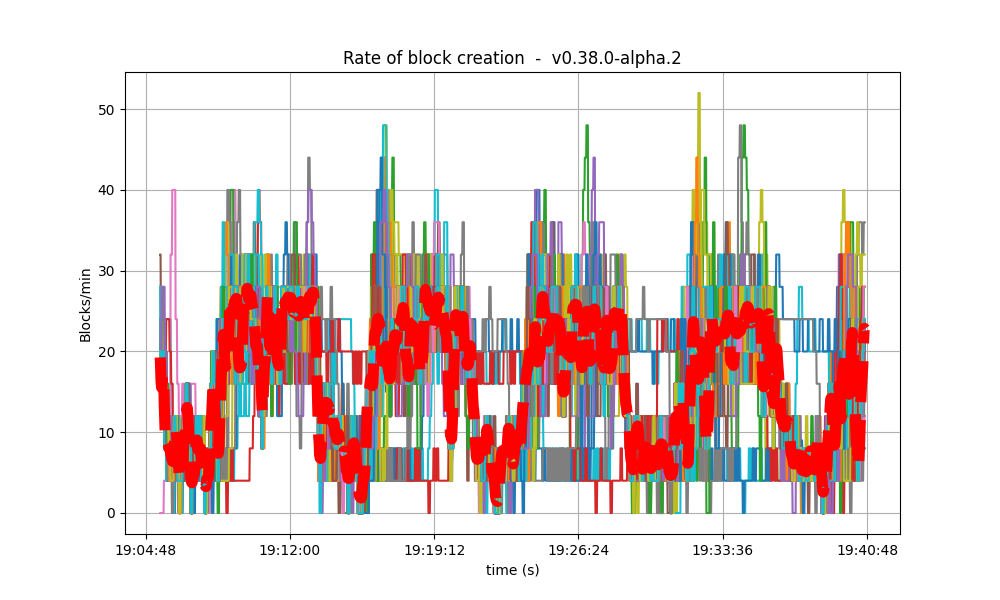 | 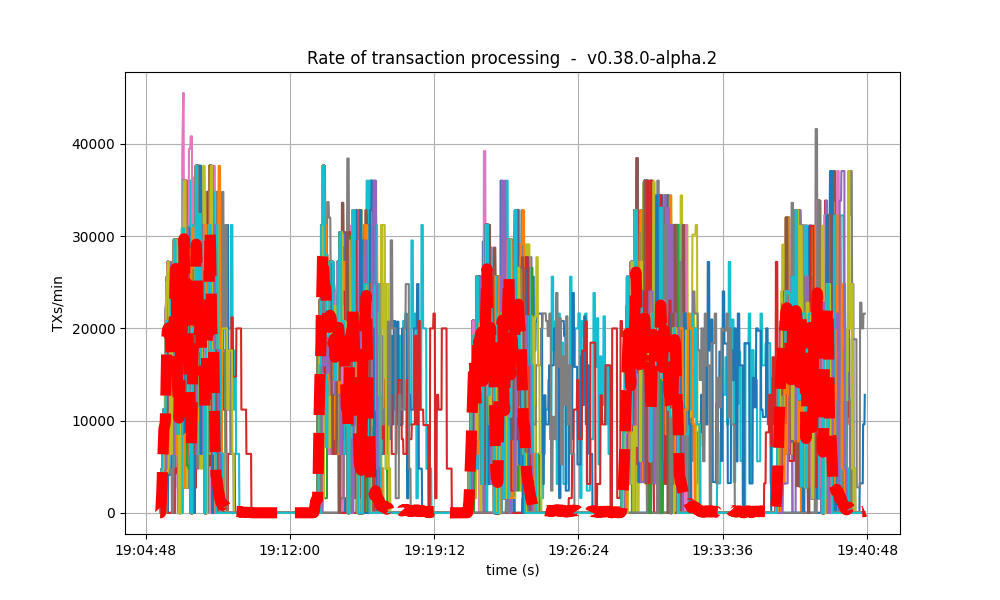 |
| 4k | 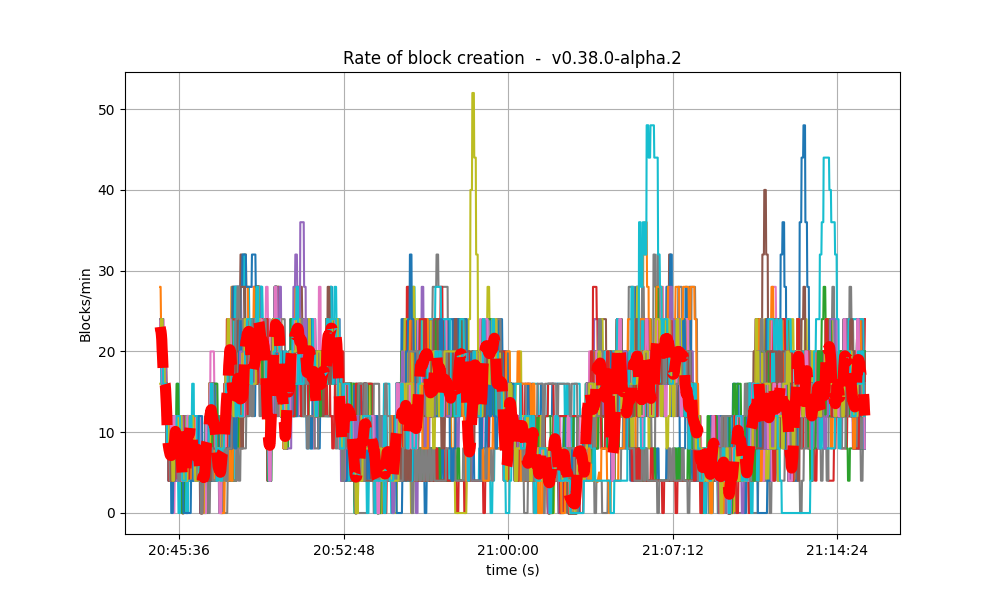 | 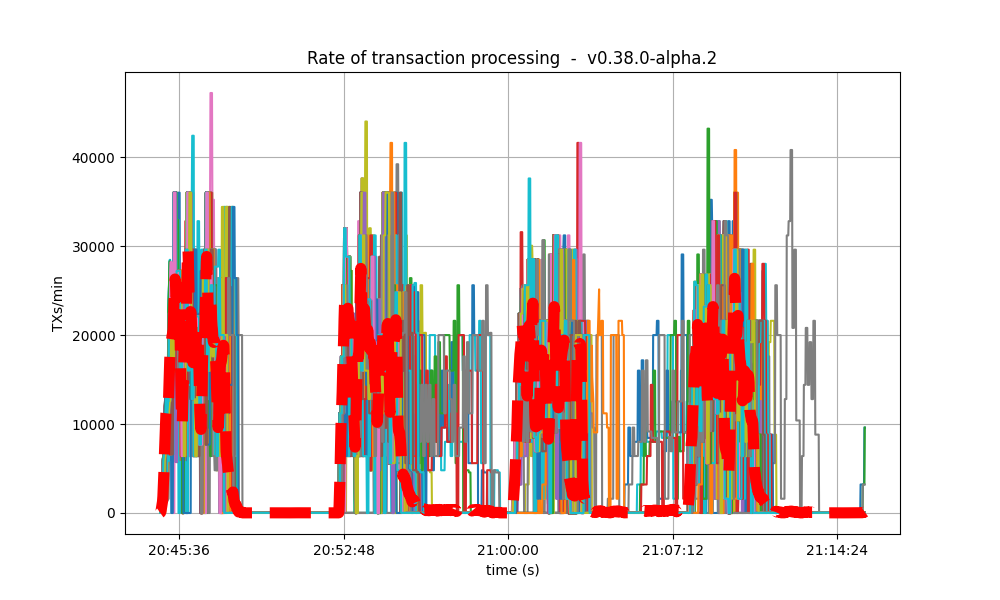 |
| 8k | 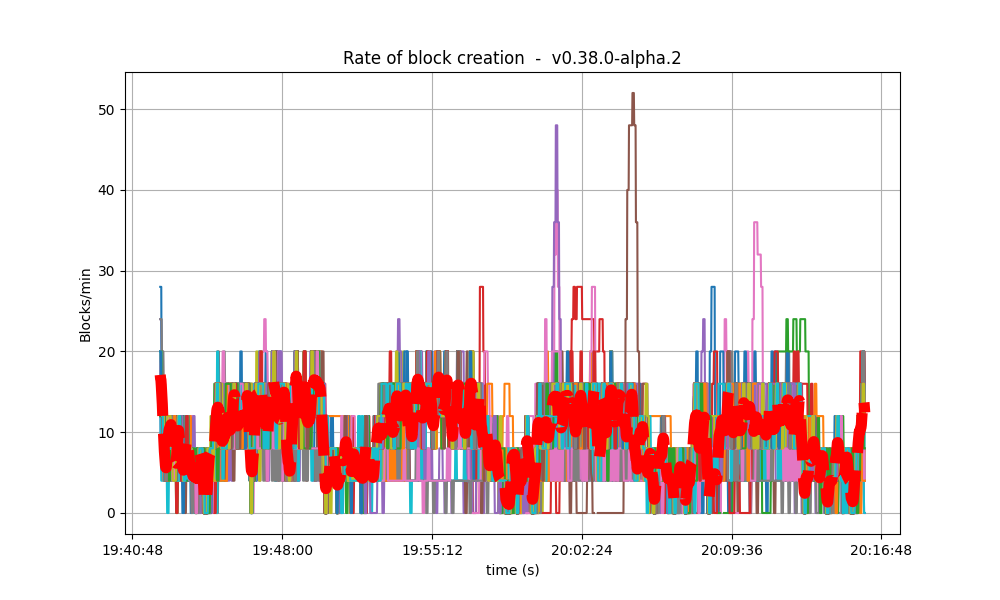 | 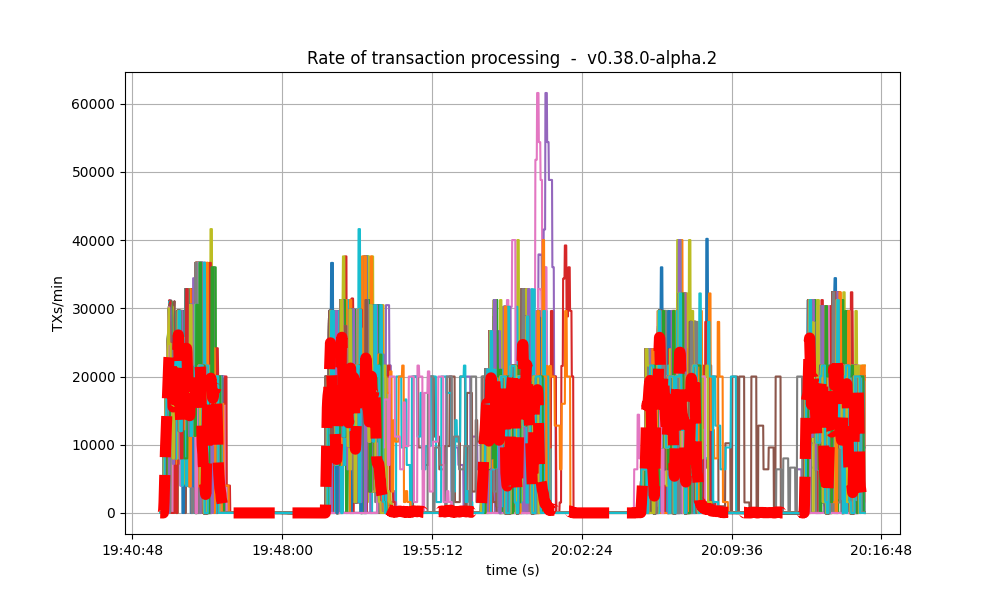 |
| 16k | 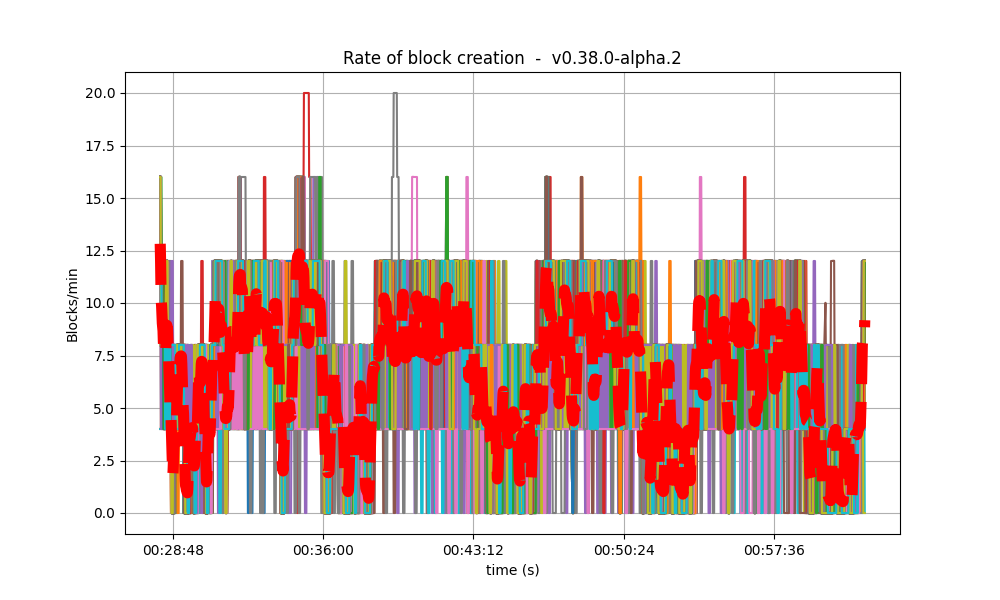 | 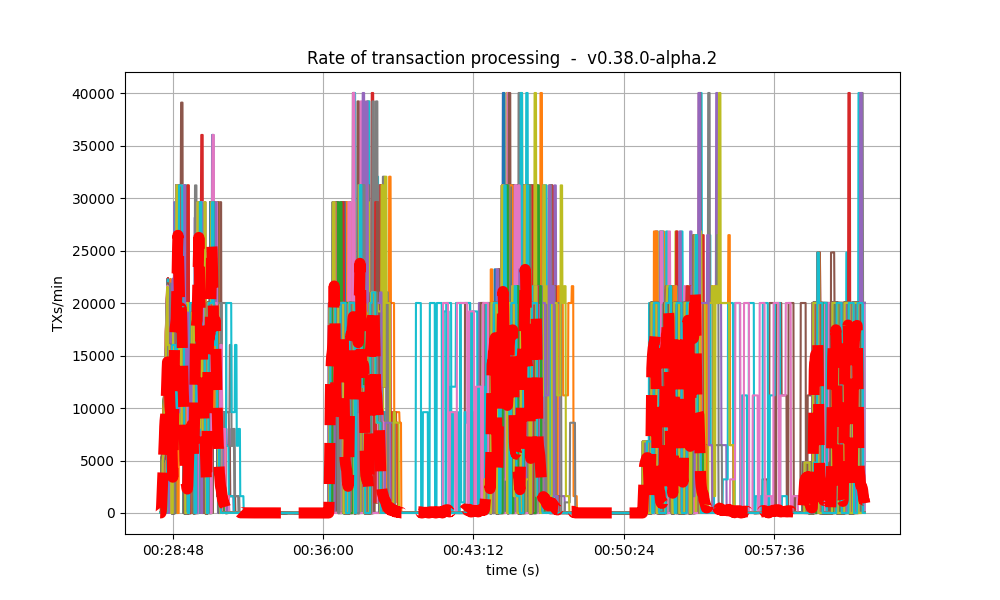 |
| 32k | 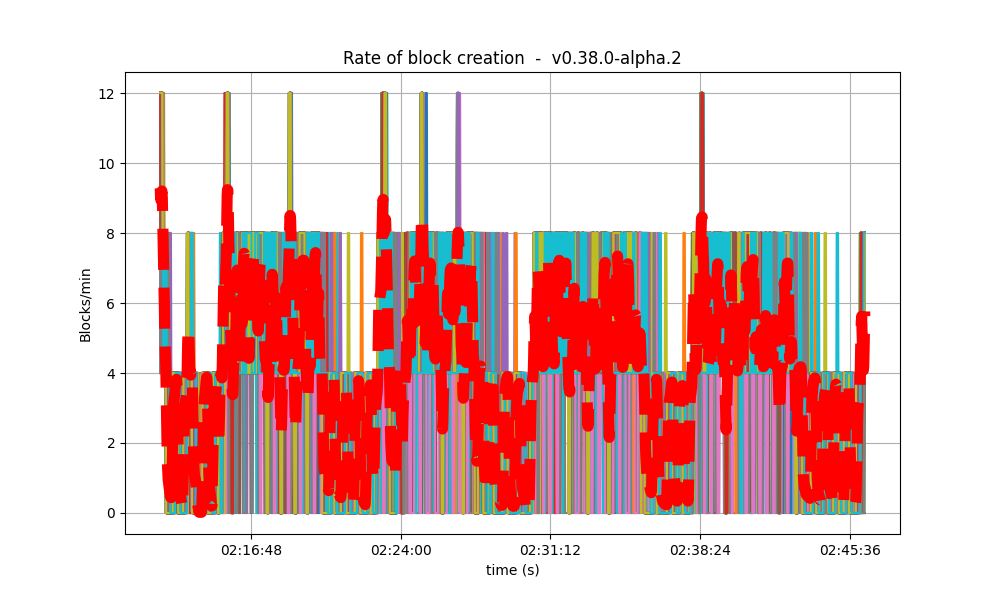 | 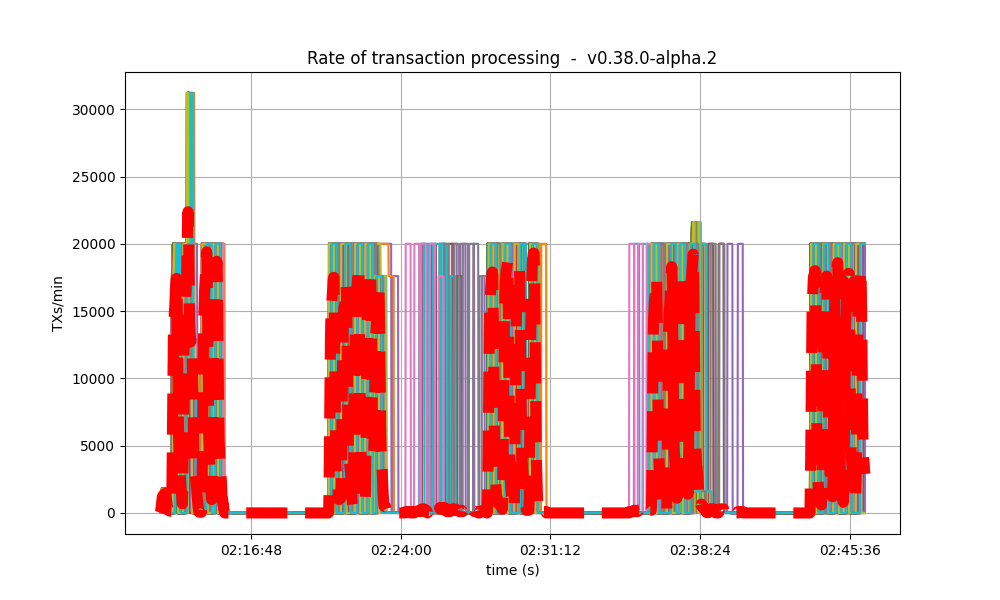 |
第一次运行
| 实验 | 区块创建速率 | 交易速率 |
|---|---|---|
| 基线 | 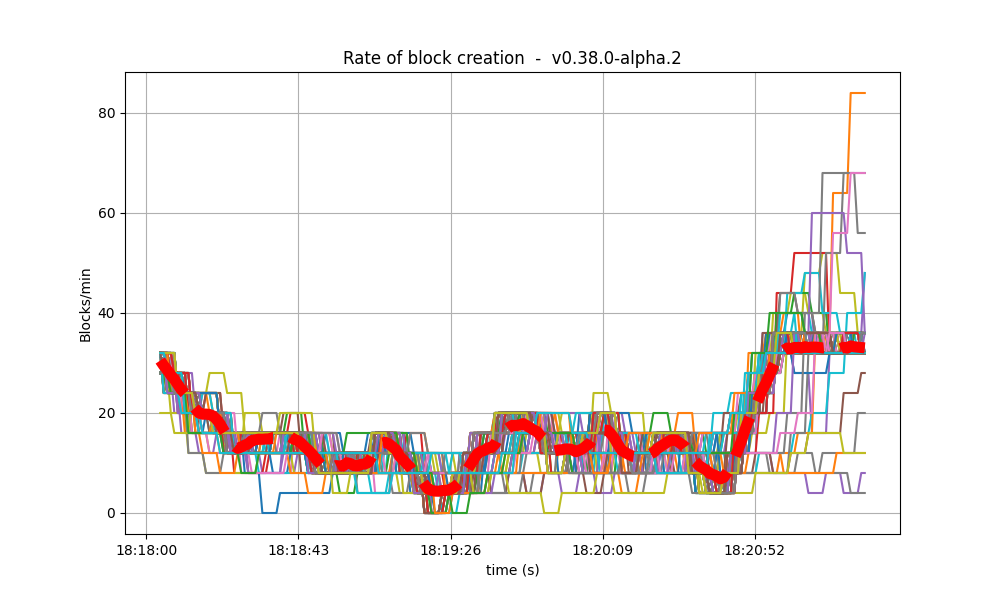 | 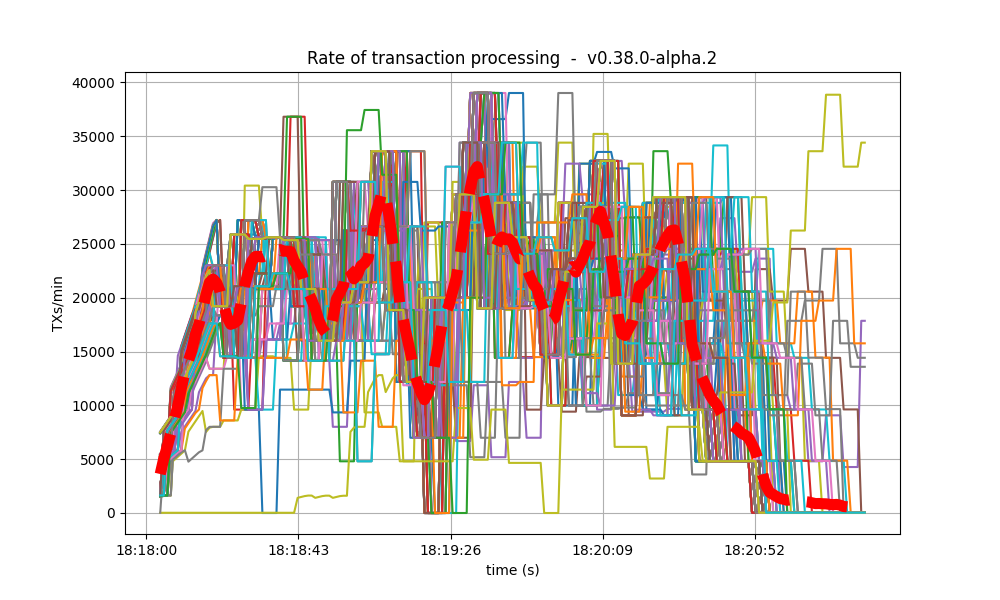 |
| 2k | 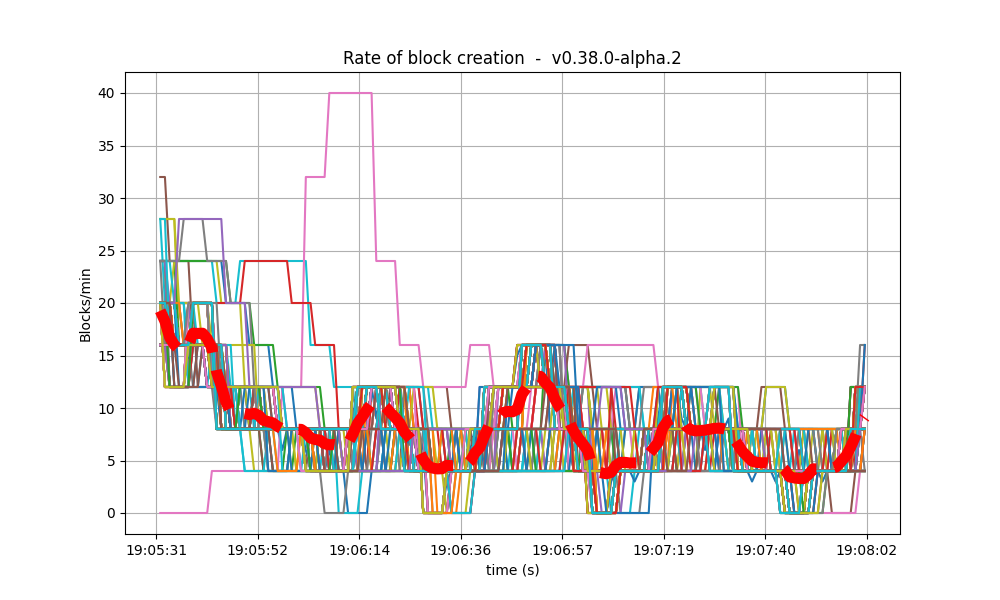 | 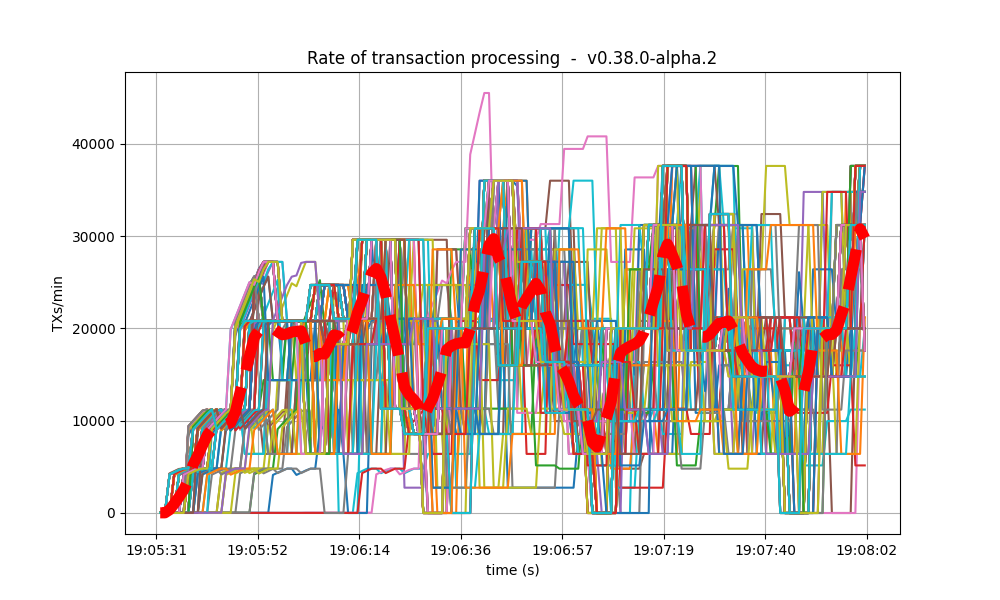 |
| 4k | 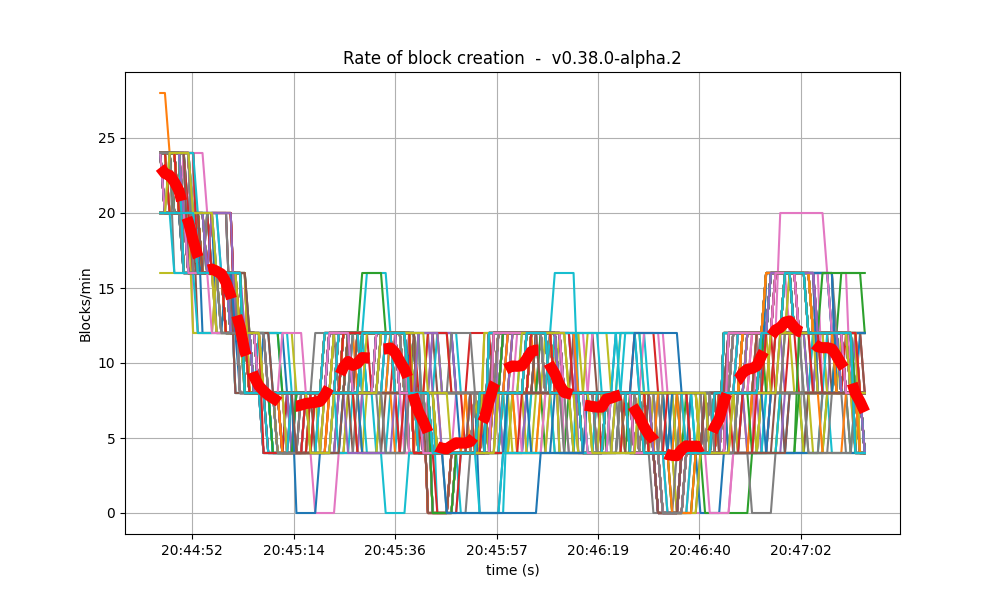 | 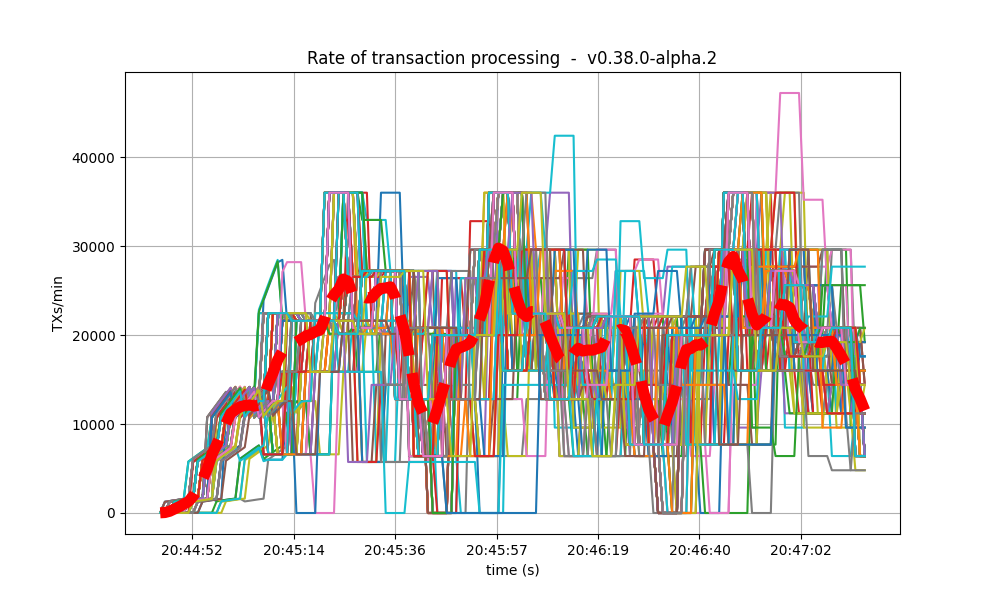 |
| 8k | 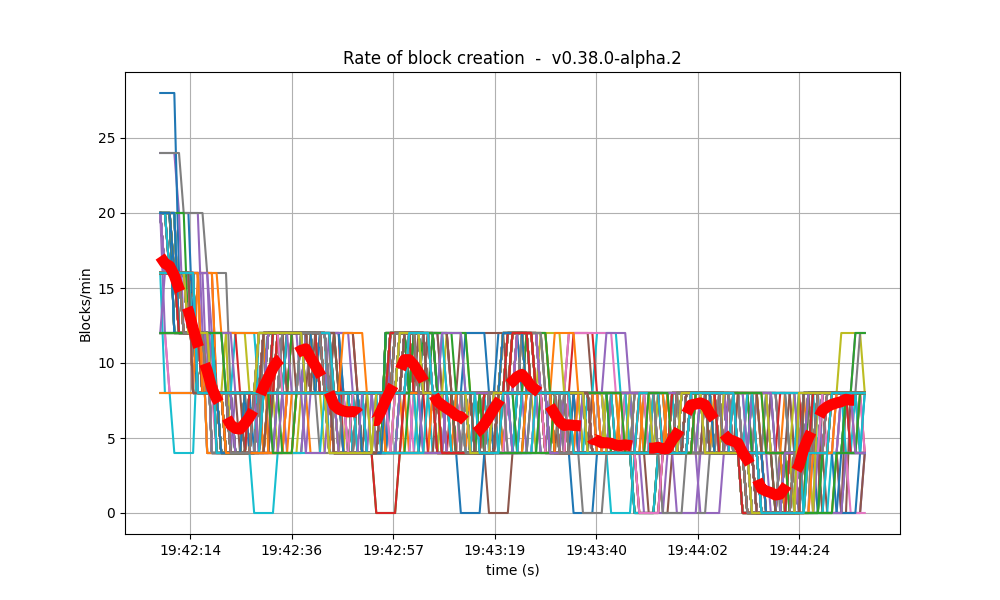 | 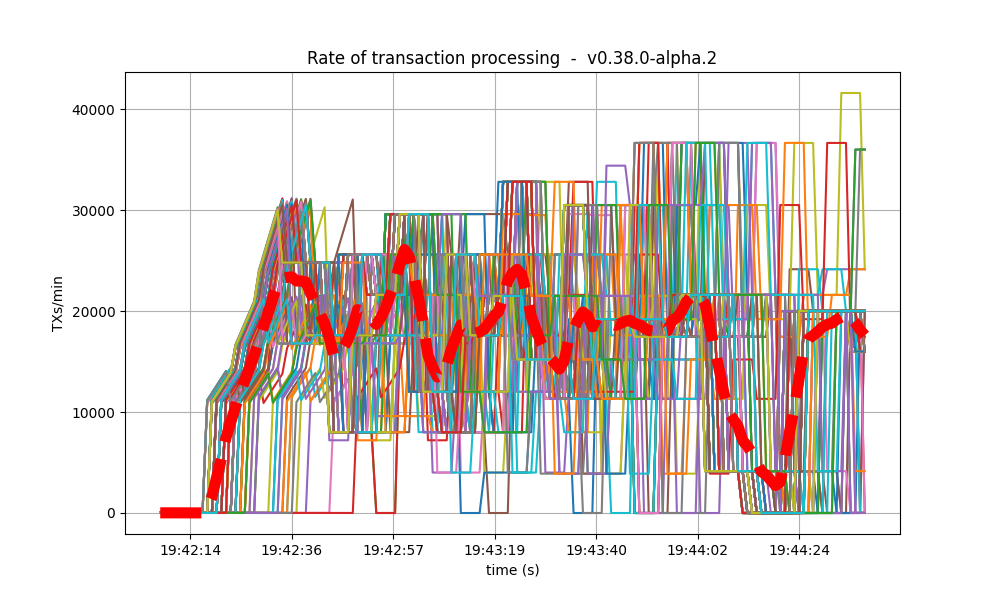 |
| 16k | 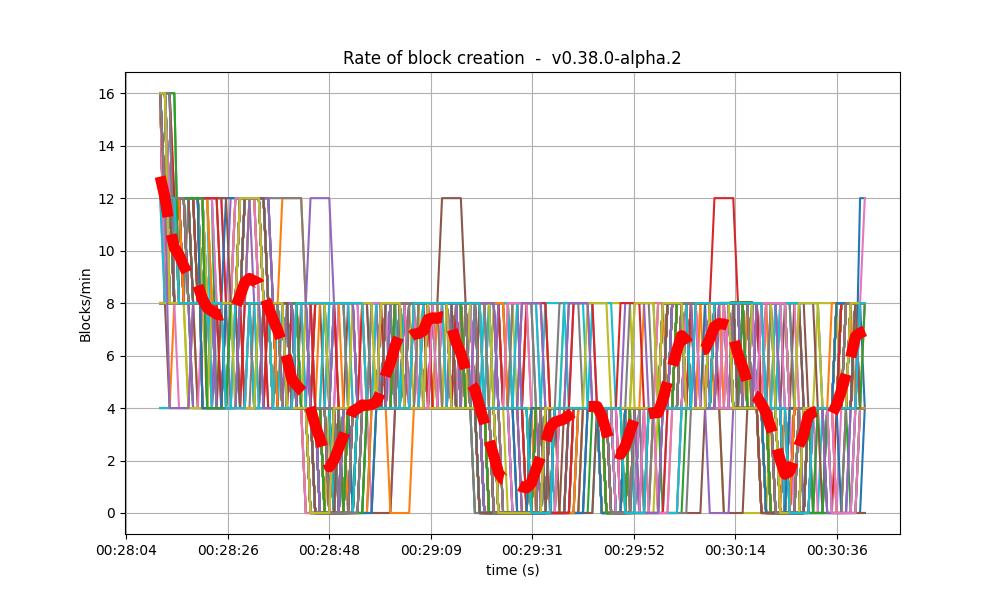 | 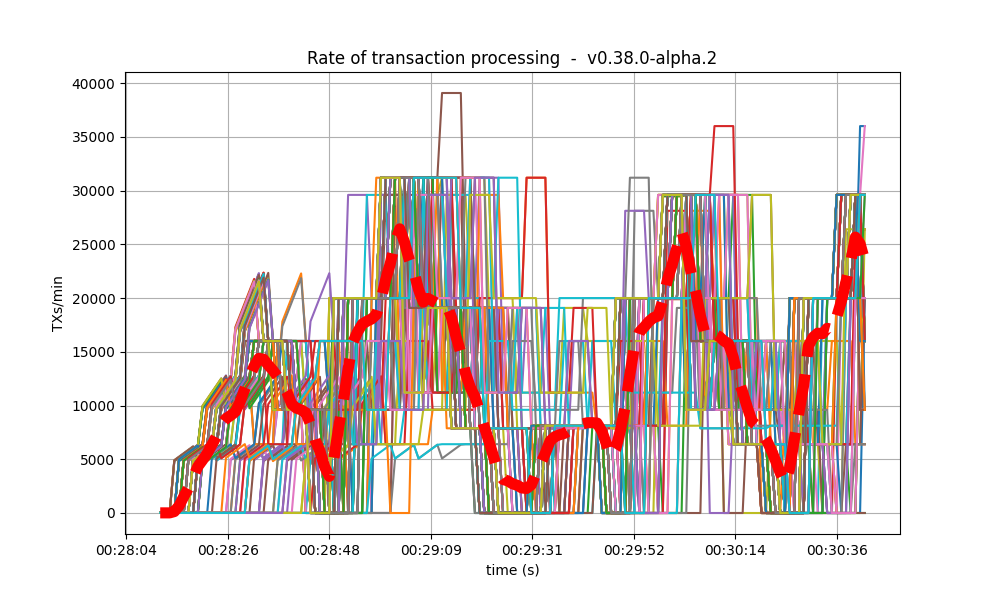 |
| 32k | 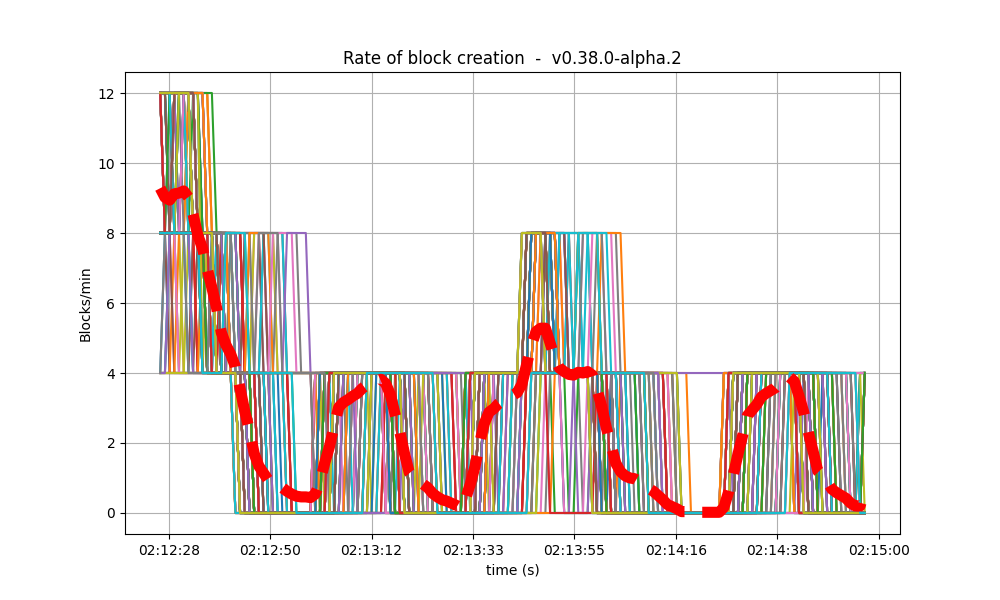 | 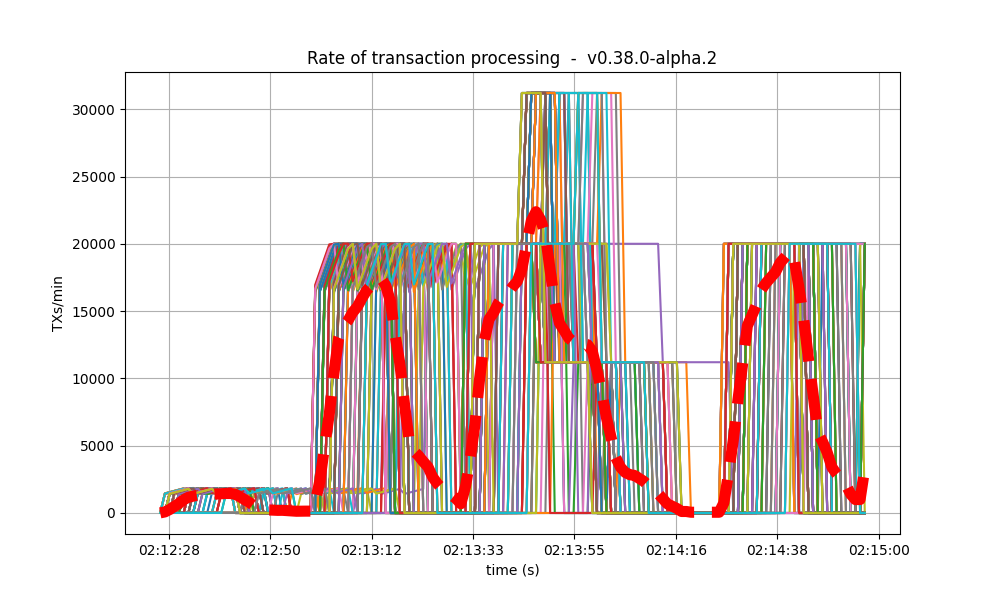 |
轮次数量
投票扩展的影响也体现在达成共识所需的轮次数量上。 下列图表展示了整个实验中,为达成共识所需的最高轮次编号。 在基线和较短投票扩展长度下,大多数区块都在第 0 轮达成共识。 随着负载增加,需要的轮次越来越多。 在 32k 情况下,我们可以看到系统频繁进入第 5 轮。| 实验 | 每个区块的轮次数 |
|---|---|
| 基线 | 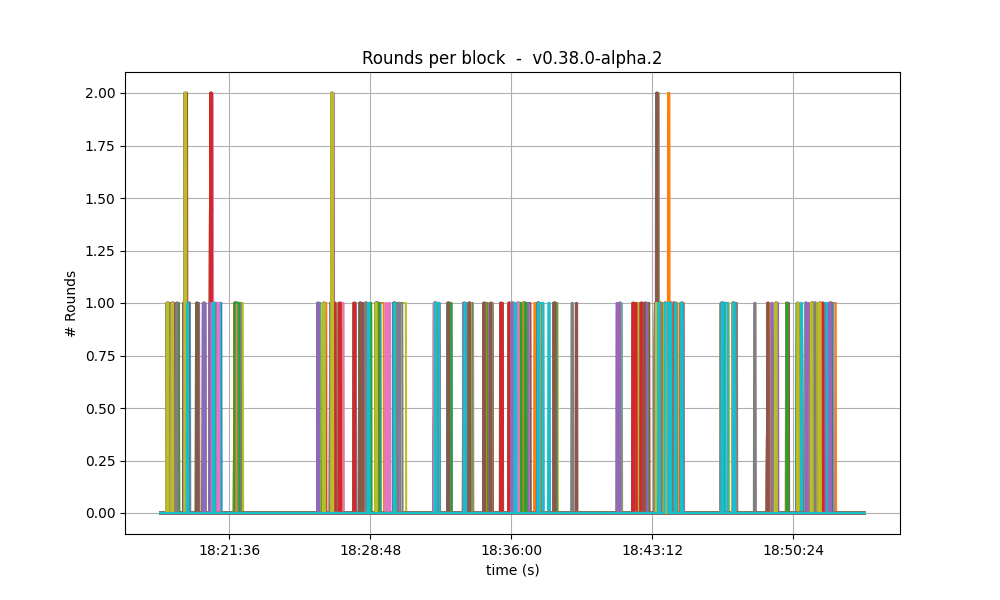 |
| 2k | 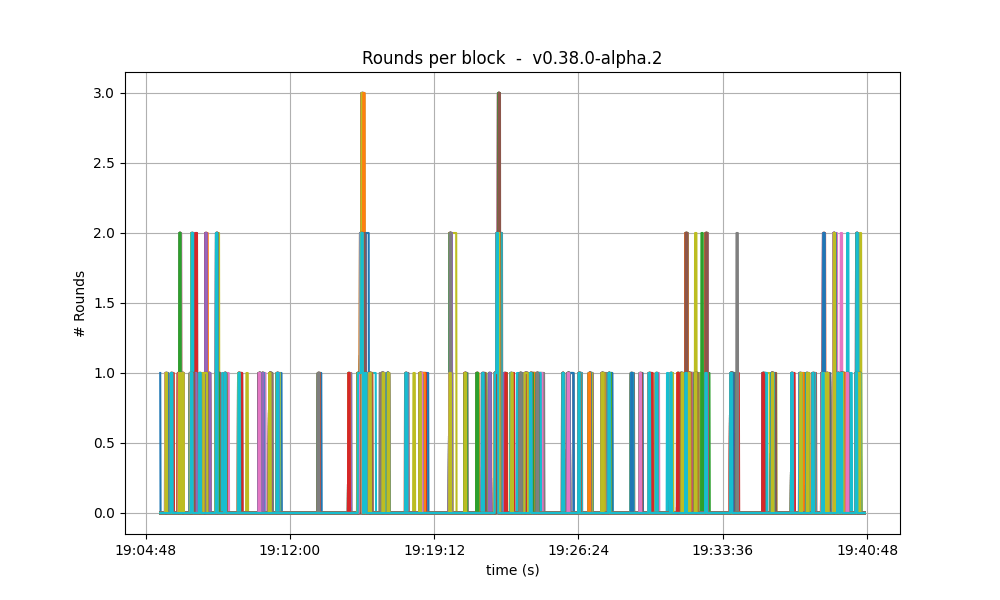 |
| 4k | 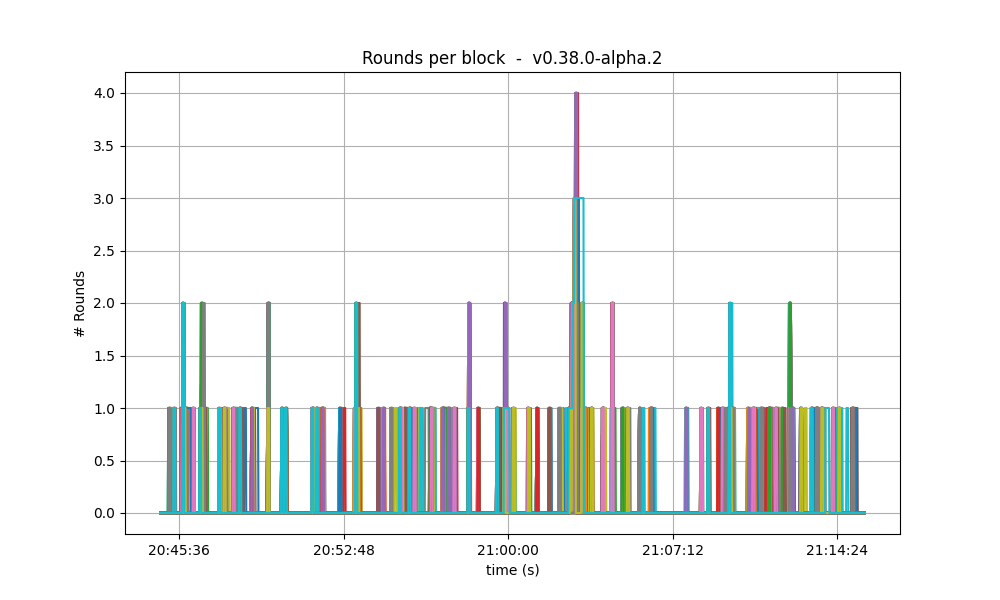 |
| 8k | 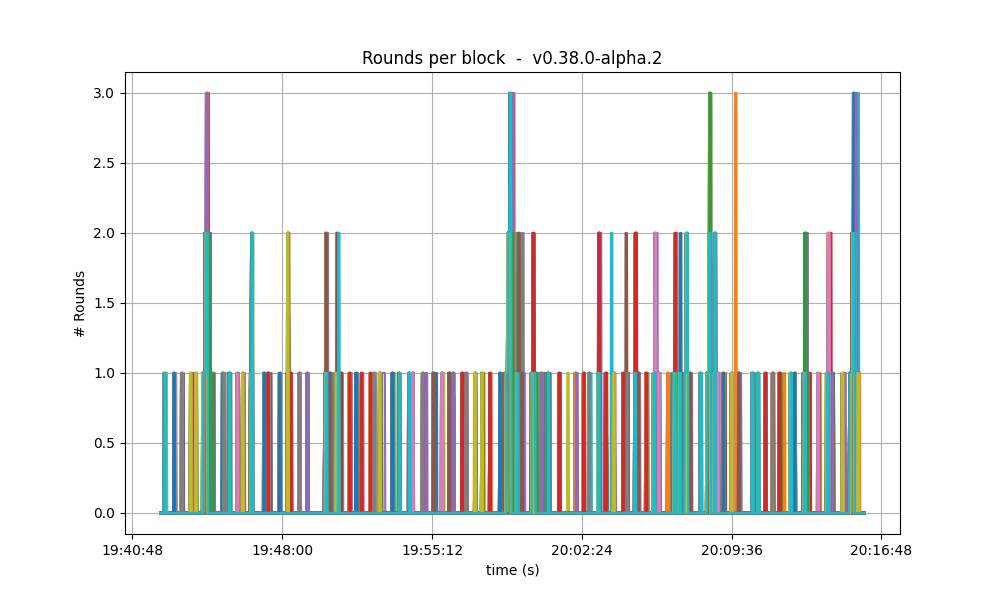 |
| 16k | 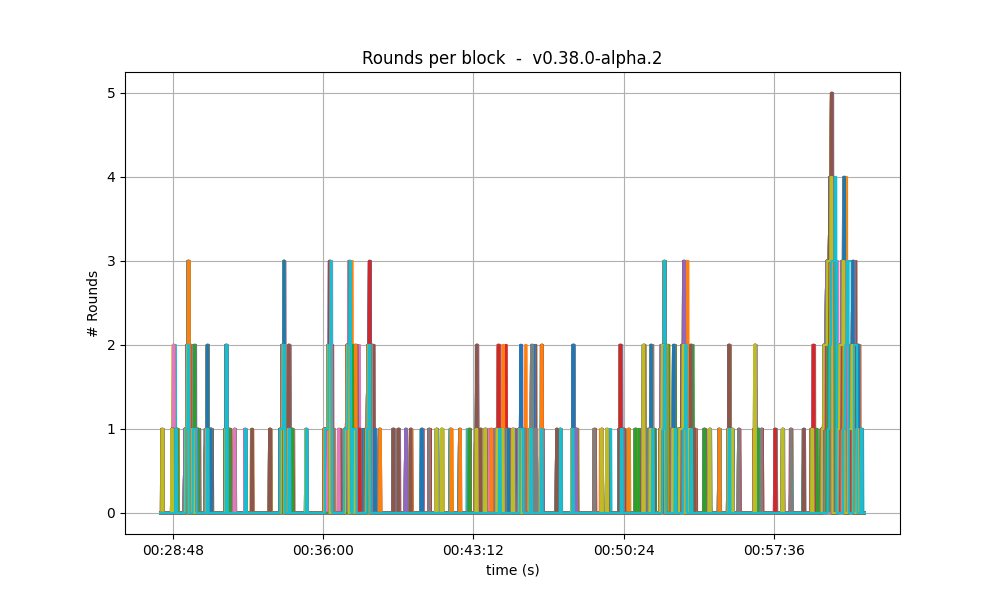 |
| 32k | 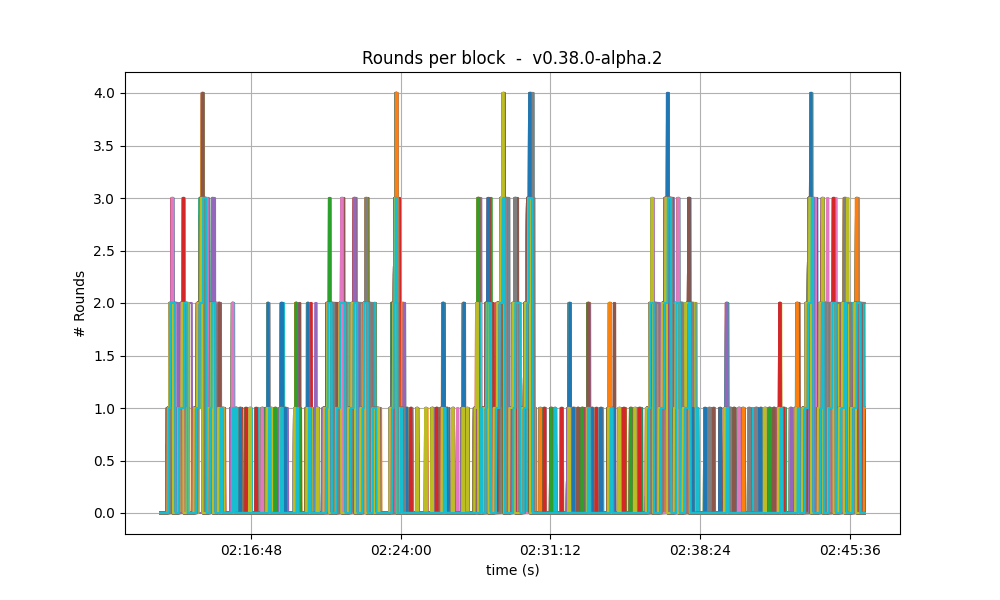 |
CPU
在所有测试中,CPU 使用率都达到了相近的峰值,但下列图表显示,投票扩展越大,节点将 CPU 使用率降回去所需的时间越长。 这可能意味着,在扩展较大的测试执行期间,系统正在形成处理积压。| 实验 | CPU |
|---|---|
| 基线 | 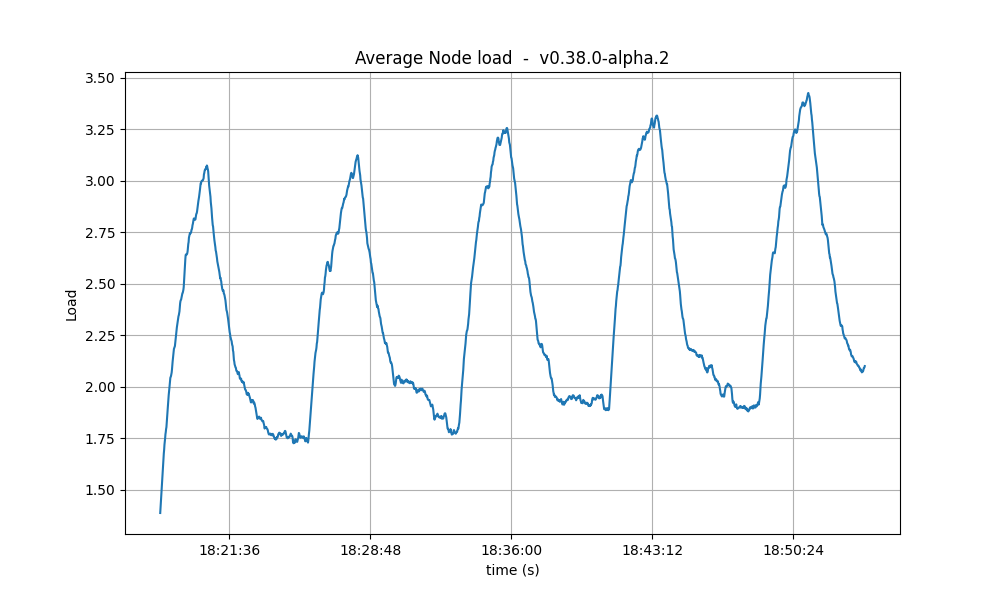 |
| 2k | 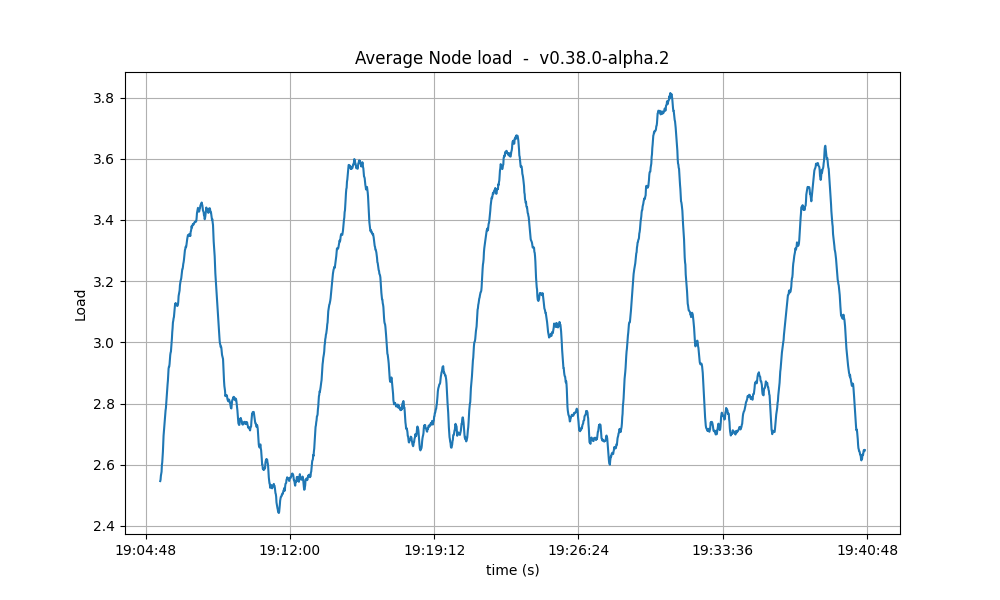 |
| 4k | 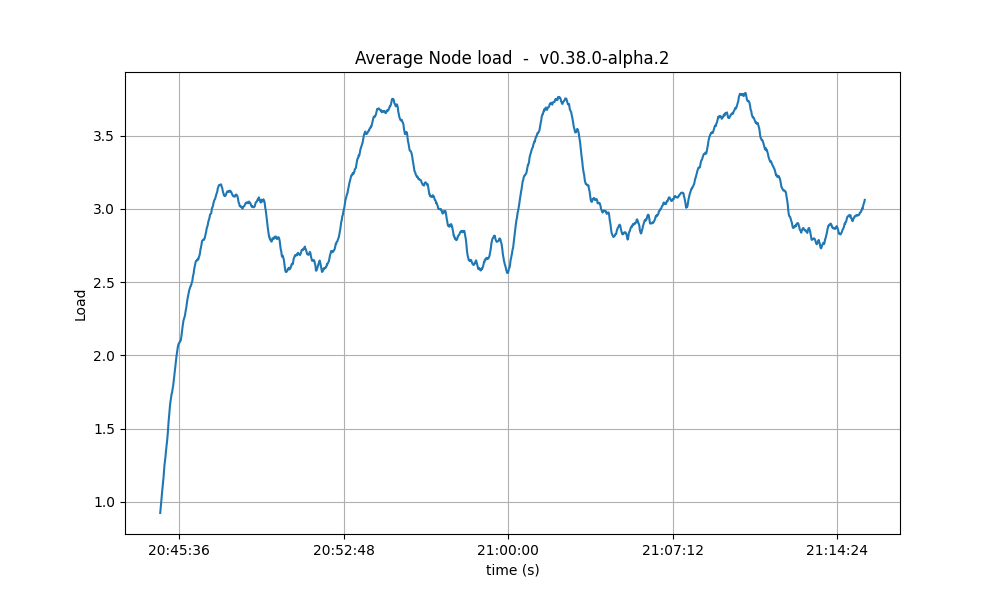 |
| 8k | 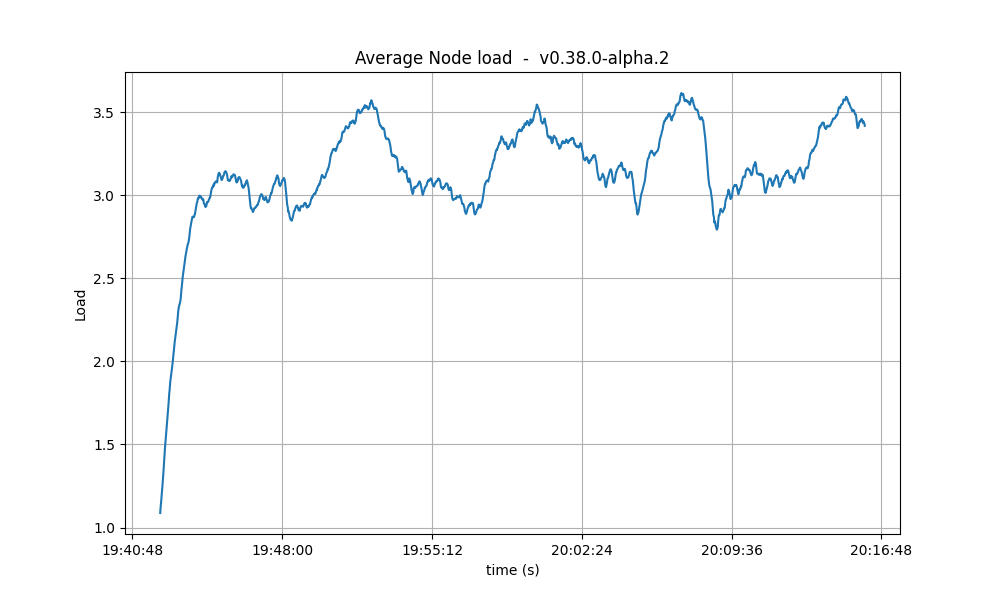 |
| 16k | 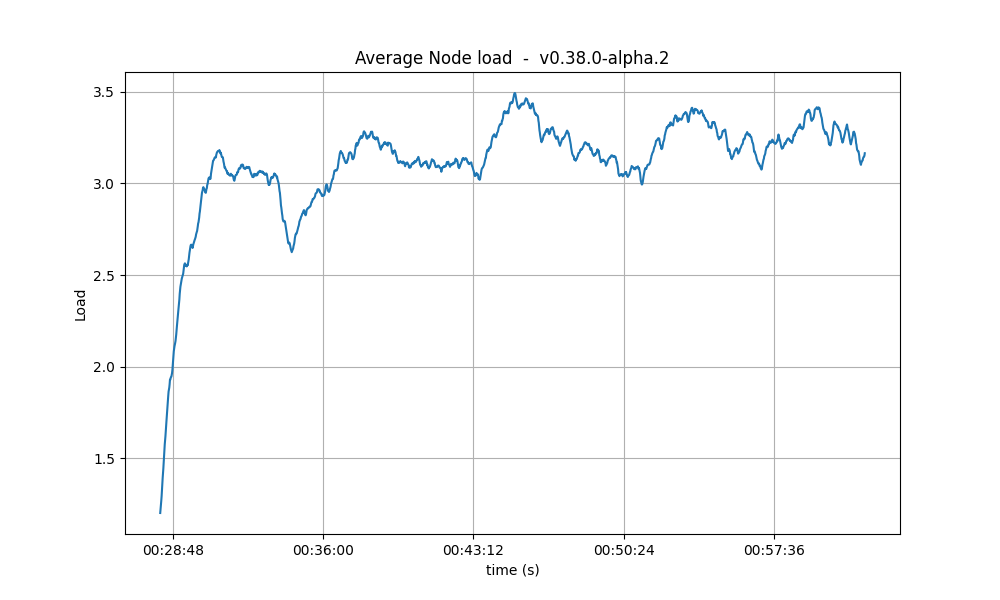 |
| 32k | 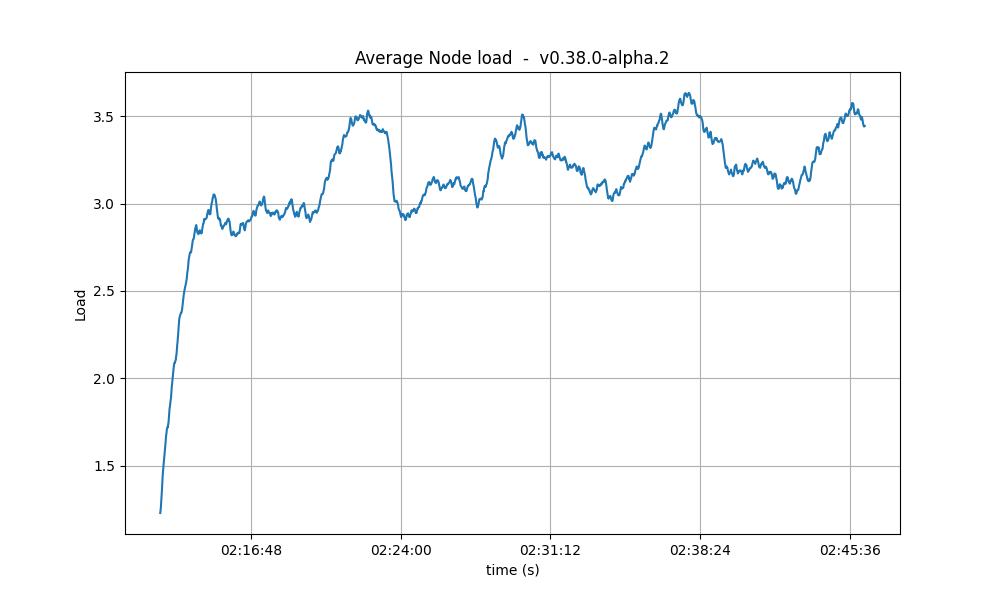 |
常驻内存
对于内存,也可以得出与 CPU 使用率相同的结论。 也就是说,测试期间会形成工作积压,而追赶过程(释放内存)发生在测试结束之后。 一个更令人担忧的趋势是,内存使用的底部值在不同运行之间似乎有所上升。 我们已在更长时间的运行中对此进行了调查,并确认不存在这种趋势。| 实验 | 常驻内存集大小 |
|---|---|
| 基线 | 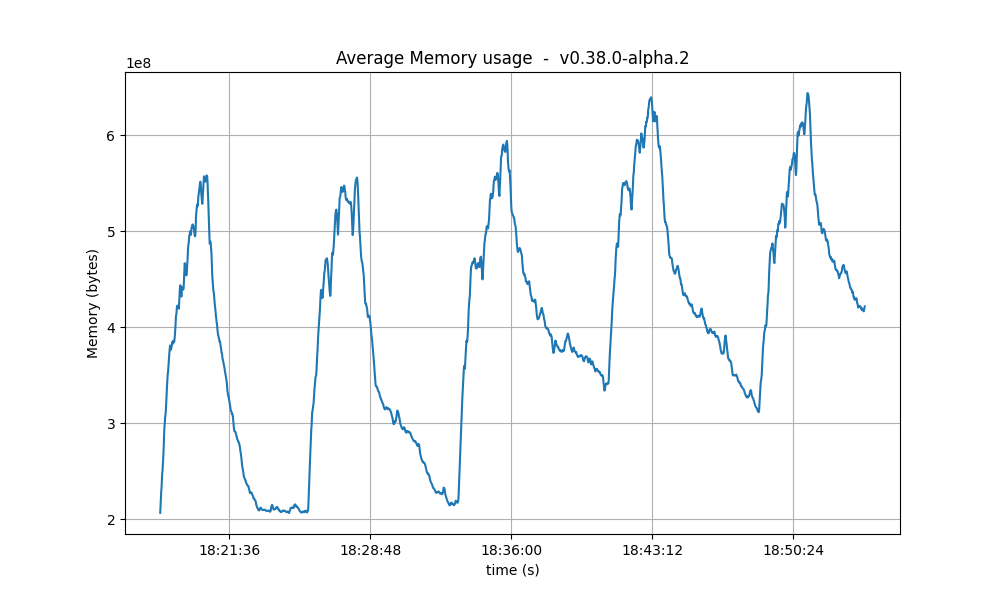 |
| 2k | 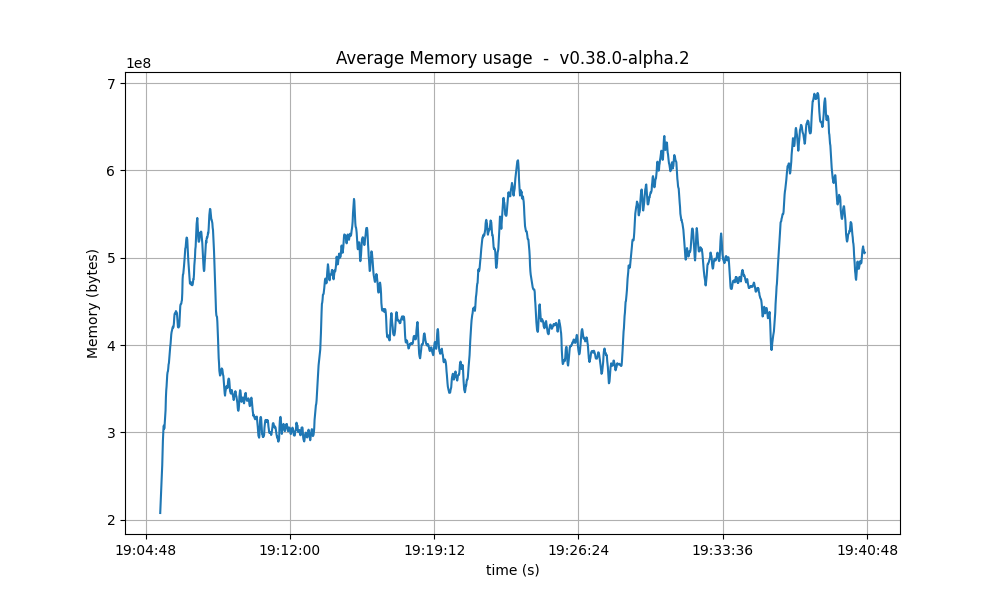 |
| 4k | 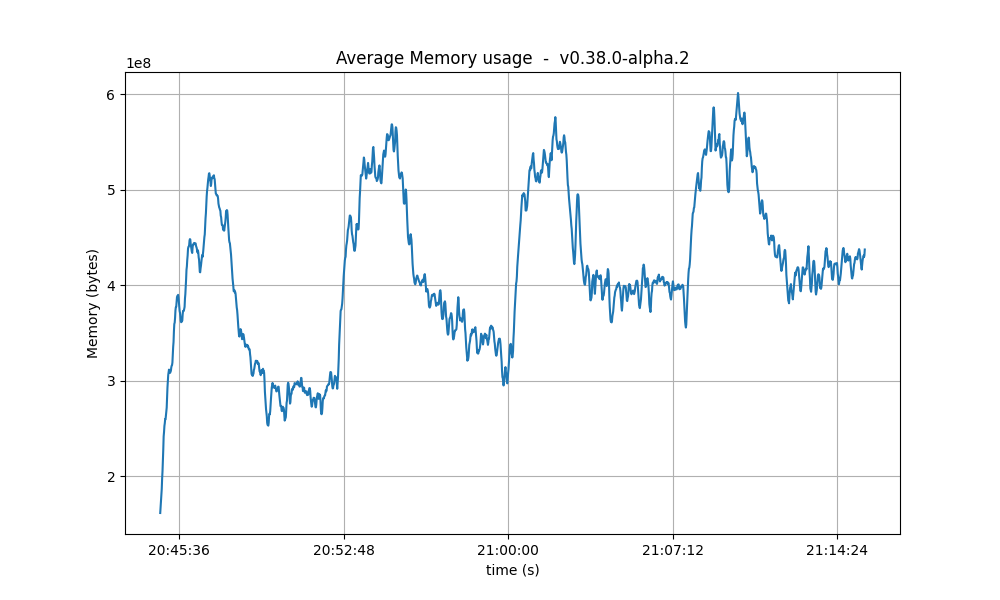 |
| 8k | 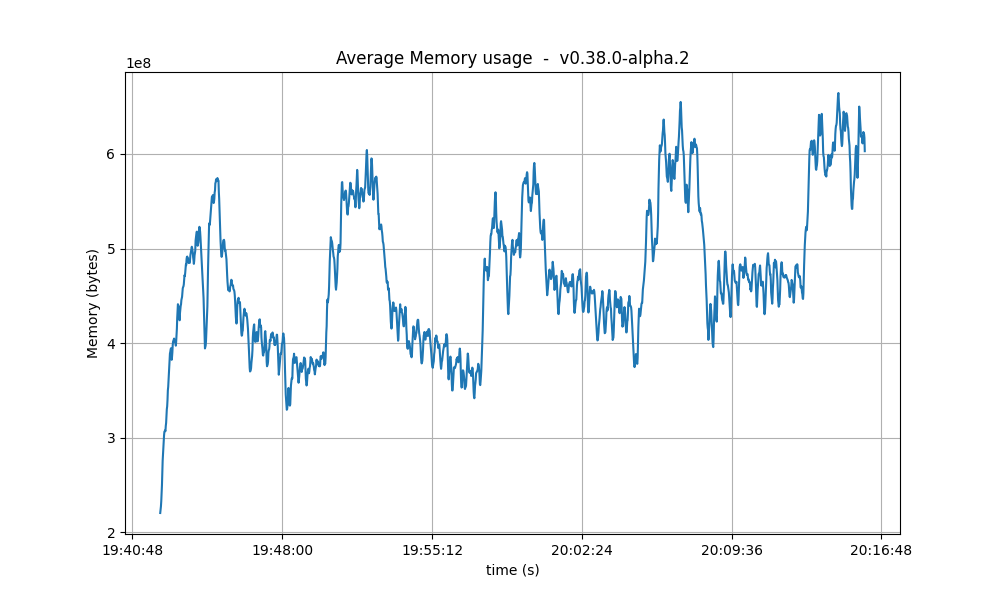 |
| 16k | 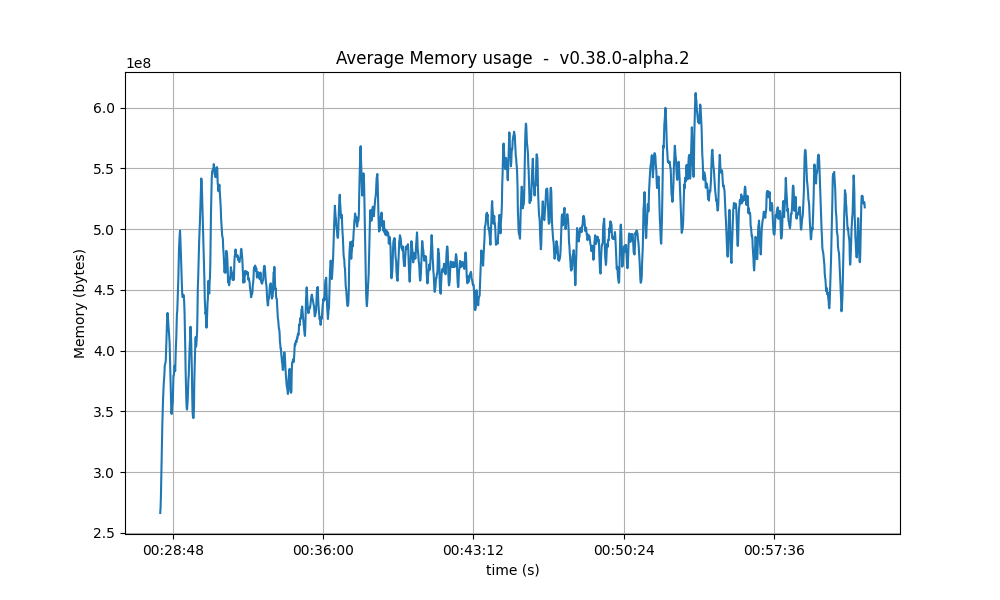 |
| 32k | 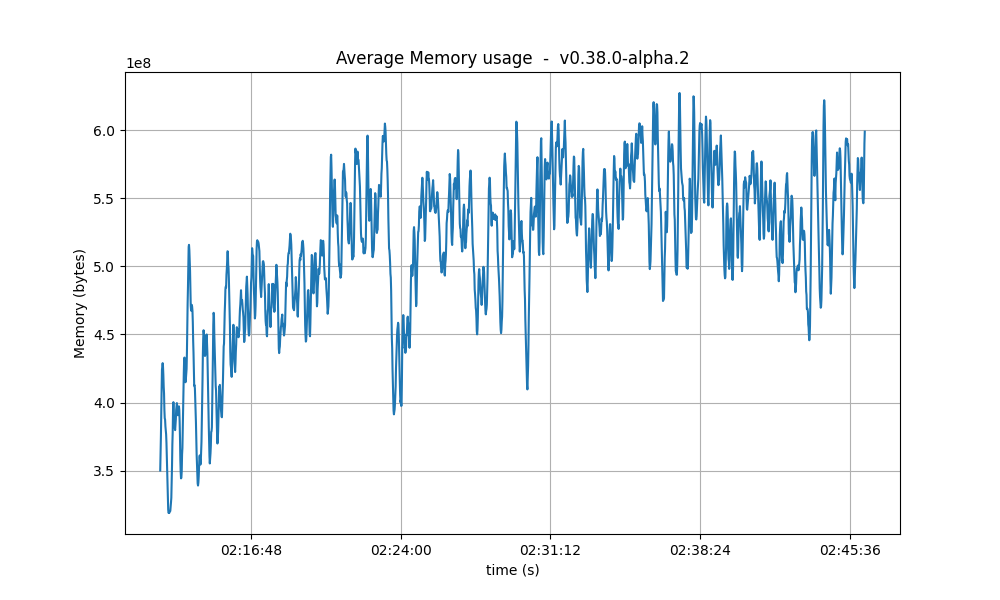 |
Mempool 大小
该指标展示节点 mempool 中仍处于待处理状态的交易数量。 请注意,在所有运行中,mempool 中交易的平均数量都会在不同运行之间迅速降至接近零。| 实验 | Mempool 大小 |
|---|---|
| 基线 | 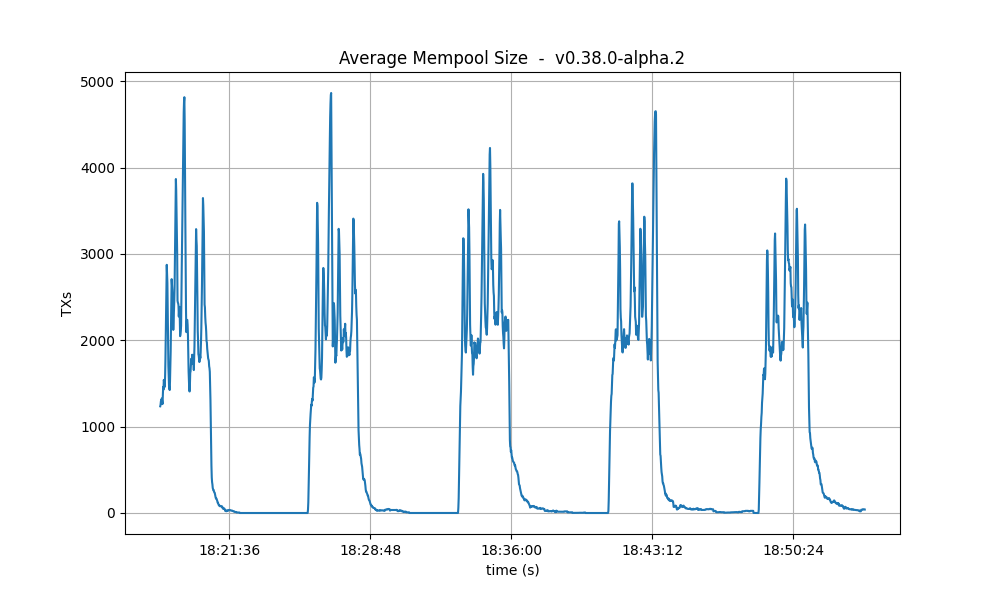 |
| 2k | 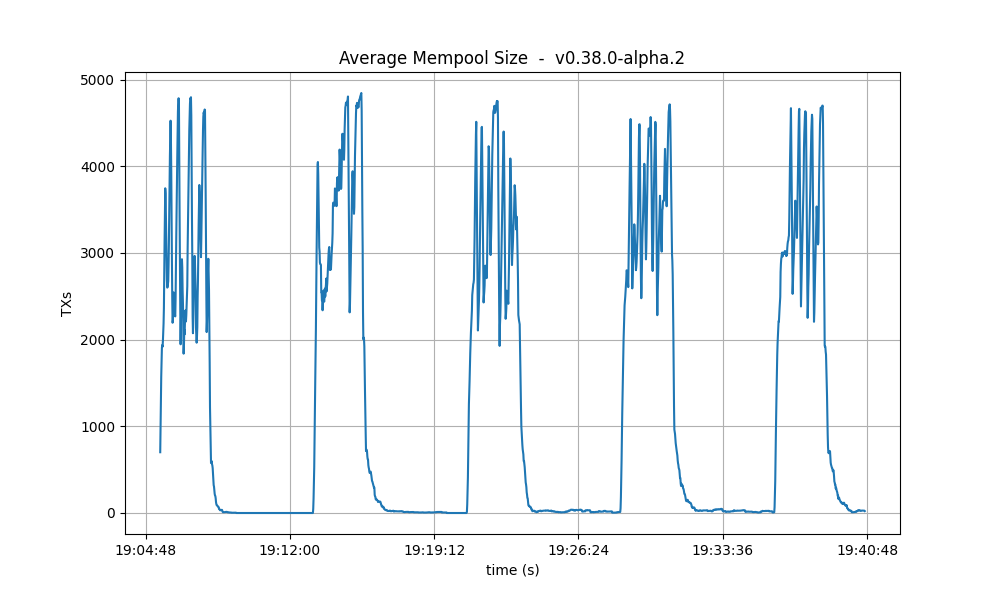 |
| 4k | 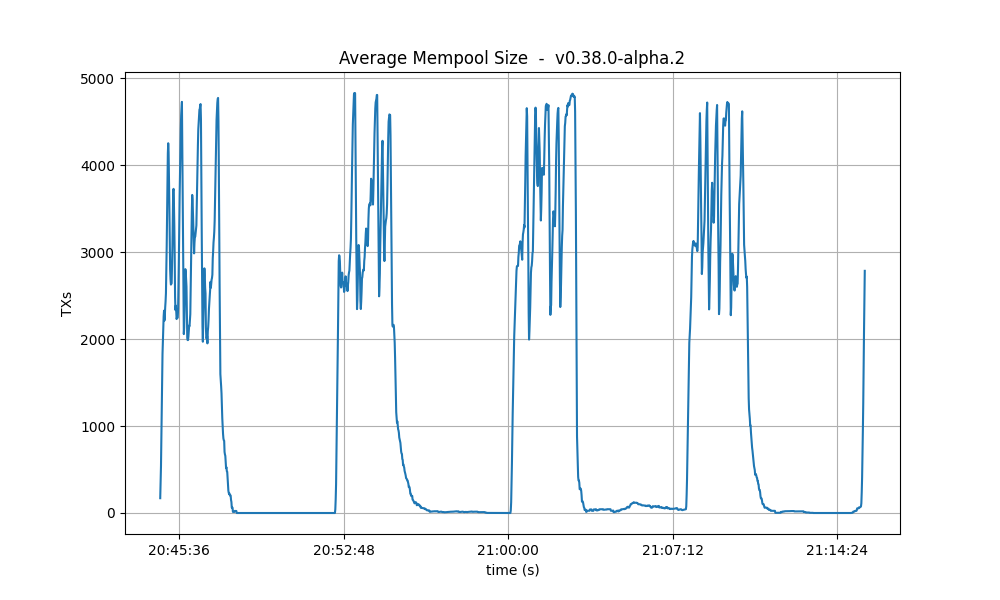 |
| 8k | 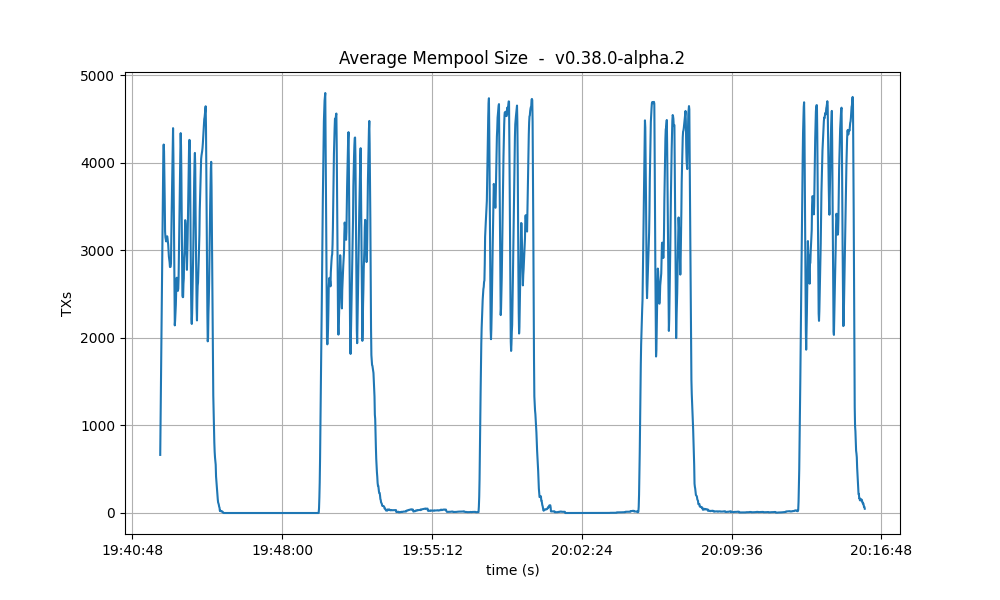 |
| 16k | 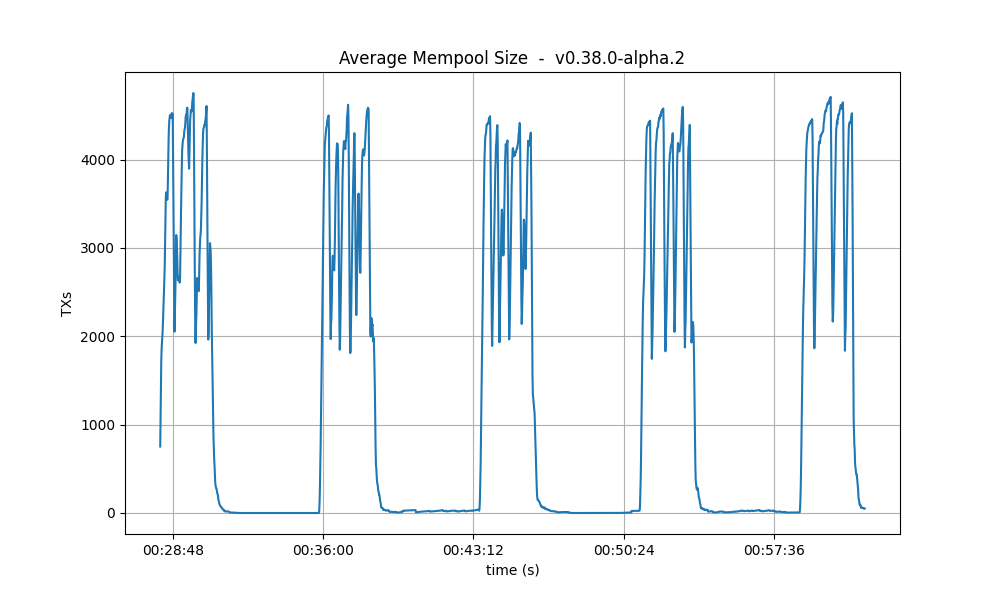 |
| 32k | 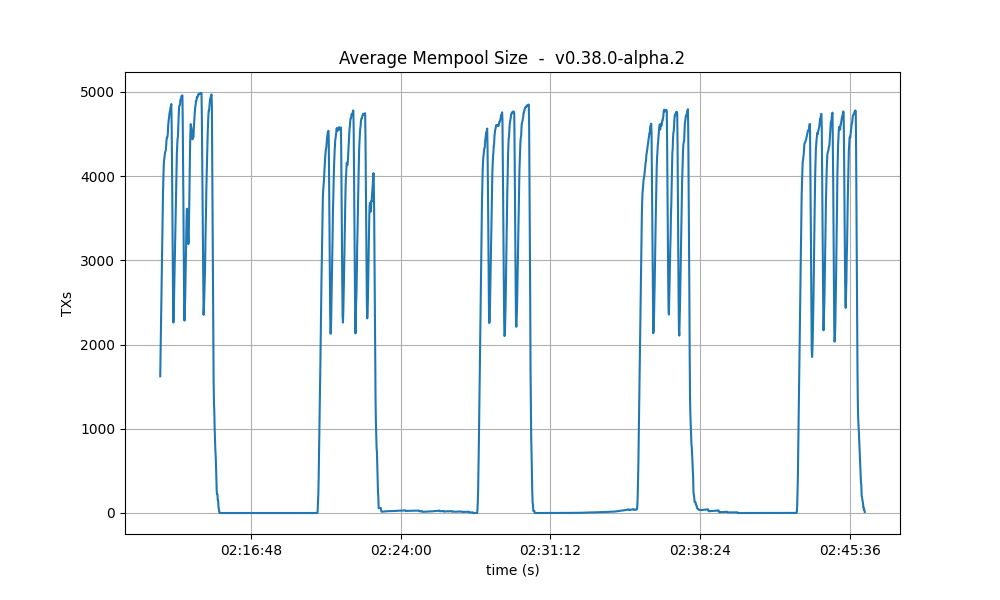 |
结果
| 场景 | 日期 | 版本 | 结果 |
|---|---|---|---|
| VESize | 2023-05-23 | v0.38.0-alpha.2 + varying vote extensions (9fc711b6514f99b2dc0864fc703cb81214f01783) | 不适用 |
CometBFT QA 结果 v0.38.x
本轮 QA 在 CometBFTv0.38.0-alpha.2 上运行,这是 CometBFT 仓库中的第二个 v0.38.x 版本。
相对于基线版本(2023 年 2 月 21 日的 v0.37.0-alpha.3),本版本的变更包括引入 FinalizeBlock 方法,以补全完整的 ABCI++ 功能范围(ABCI 2.0),以及更新日志中描述的若干其他改进。
发现的问题
- (严重,已修复) #539 和 #546 - 该缺陷会导致 proposer 在
PrepareProposal中崩溃,因为它应当拥有扩展时却没有。 这种情况主要发生在 proposer 正在追赶状态时。 - (严重,已修复) #562 - 指标相关逻辑中存在若干缺陷,在测试网启动时会触发 panic。
200 节点测试网
与 QA 过程的其他迭代一样,我们使用了一个 200 节点网络作为测试平台,并额外加入了一些节点来施加负载和收集指标。饱和点
与以往的 QA 实验一样,我们首先找出系统开始出现性能下降时的交易负载。随后,我们在略低于饱和点的负载下运行实验。用于识别饱和点的方法可见这里,其在基线版本上的应用见这里。 下表汇总了不同实验的结果(摘自v038_report_tabbed.txt)。X 轴(c)表示负载发生器进程到目标节点建立的连接数。Y 轴(r)表示每秒发出的交易速率或数量。
| c=1 | c=2 | c=4 | |
|---|---|---|---|
| r=200 | 17800 | 33259 | 33259 |
| r=400 | 35600 | 41565 | 41384 |
| r=800 | 36831 | 38686 | 40816 |
| r=1600 | 40600 | 45034 | 39830 |
c=1,r=400 和 c=2,r=200 定义的对角线之外进入饱和。对角线上的条目具有相同的交易负载,因此可以视为等价。对于选定的对角线,预期处理的交易数为 1 * 400 tx/s * 89 s = 35600。(注意,我们使用实验 90 秒中的 89 秒,因为最后一批交易与实验结束同时发生,因此不会被发送。)位于其下一条对角线的实验预期处理数量是其两倍,即 1 * 800 tx/s * 89 s = 71200,但系统无法处理这样的负载,因此已达到饱和。
因此,在后续实验中,我们选择 c=1,r=400 作为配置。我们本来也可以选择等价的 c=2,r=200,这也是基线版本使用的配置,但为简化起见,我们决定使用只有一个连接的方案。
另外需要注意的是,相比之前的 QA 测试,我们尝试在更高的 r 取值范围内寻找饱和点。具体来说,本次测试中 r 取值为 200 或更高,而之前的测试中 r 为 200 或更低。特别是,对于基线版本,我们没有运行配置 c=1,r=400 的实验。
作为对比,下表展示了基线版本的结果,其中饱和点位于由 r=200,c=2 和 r=100,c=4 定义的对角线之外。
| c=1 | c=2 | c=4 | |
|---|---|---|---|
| r=25 | 2225 | 4450 | 8900 |
| r=50 | 4450 | 8900 | 17800 |
| r=100 | 8900 | 17800 | 35600 |
| r=200 | 17800 | 35600 | 38660 |
延迟
下图展示了使用配置c=1,r=400 运行的实验延迟。
作为参考,下图展示了基线版本中某次 c=2,r=200 实验的延迟。
可以看到,在大多数情况下,两者的延迟非常接近;在某些情况下,基线版本的延迟还略高于被测版本。因此,从这个小规模实验可以认为,两者测得的延迟是等价的,或者至少可以说被测版本并不比基线更差。
所选实验的 Prometheus 指标
本节进一步分析从 Prometheus 数据中提取出的关键指标,这些数据对应所选的c=1,r=400 配置实验。
Mempool 大小
mempool 大小即 mempool 中交易数量的计数,在所有全节点上都表现为稳定且较为一致,没有出现无约束增长。下图展示了在任意时刻所有全节点 mempool 内交易累计数量随时间的变化。
下图展示了所有全节点平均 mempool 大小随时间的变化,大多数时候在 1000 到 2500 笔待处理交易之间波动。
观察到的峰值与部分节点在共识中进入第 1 轮的时刻一致(见下文)。
这种行为与下面展示的基线版本表现相似。
Peer 数量
所有节点的 peer 数量都较为稳定。seed 节点的 peer 数量更高(约 140),其余节点则多数介于 20 到 70 之间。红色虚线表示平均值。
和下面展示的基线版本一样,非 seed 节点会超过 50 个 peer,这一点是由 #9548 导致的。
每个高度的共识轮次
大多数高度只需要一轮,也就是第 0 轮,但也有一些节点需要推进到第 1 轮。
下图所示的这次基线运行中,也有一些节点需要进入第 1 轮。
每分钟产生的区块数、每分钟处理的交易数
下图从每个节点的视角展示了区块创建速率。也就是说,它展示了每个节点何时得知一个新区块已经达成共识。
在系统持续承受负载的大部分时间里,大多数节点维持在约 20 个区块/分钟。
超过 100 个区块/分钟的峰值是由于某个较慢节点在追赶进度。
基线版本也表现出类似行为。
图右侧的集体尖峰标志着负载注入结束,此时区块变得更小(为空),对网络造成的压力也更小。下面展示每分钟处理交易数的图也反映了这一行为。
下图展示基线版本的交易处理速率,与上图相似。
常驻内存集大小
下图展示了所有被监控进程的常驻内存集大小(Resident Set Size),最大内存使用为 1.6GB,略低于后面展示的基线版本。
基线版本表现出类似行为,且内存使用甚至略高一些。
随着负载移除,所有进程的内存都下降了,没有出现无约束增长的迹象。
CPU 利用率
与基线对比
在 Unix 机器上,从 Prometheus 中衡量 CPU 利用率的最佳指标是load1,它通常会出现在top 的输出中。
如下图所示,大多数节点的负载都保持在 5 以下。
基线版本也有类似表现。
投票扩展签名校验的影响
需要特别指出的是,基线版本(v0.37.x)并未实现投票扩展,而被测版本(v0.38.0-alpha.2)_已经_实现,并且配置为从高度 1 开始启用。
测试中使用的 e2e 应用会在每个高度对所有接收到的投票扩展签名(最多 175 个)校验两次:一次是在 PrepareProposal 时(用于健全性检查),另一次是在 ProcessProposal 时(用于展示真实应用可以如何执行该校验)。
基线版本与 v0.38.0-alpha.2 的 CPU 利用率图没有明显差异,这意味着在 CometBFT 从网络接收投票扩展时完成初始校验之外,再额外对最多 175 个投票扩展签名执行两次重新校验,在当前系统版本中不会带来性能影响:瓶颈出现在别处。
因此,我们应当将优化重点放在系统的其他部分,也就是导致当前瓶颈的部分(mempool gossip 重复、更加精简的 proposal 结构、优化的 consensus gossip)。
测试结果
与基线结果的比较表明,这两个场景的数值相近,因此可以认为两者等价。 下表给出了这些测试的摘要,以及实验中使用的提交版本。| 场景 | 日期 | 版本 | 结果 |
|---|---|---|---|
| 200 节点 | 2023-05-21 | v0.38.0-alpha.2 (1f524d12996204f8fd9d41aa5aca215f80f06f5e) | 通过 |
轮换节点测试网
我们使用c=1,r=400 作为负载,这可以视为一种安全工作负载,因为它接近 200 节点测试网中的饱和点,但尚未达到。这个测试网的节点更少(10 个验证者和 25 个全节点)。
需要特别说明的是,本节采用的基线版本是 v0.37.0-alpha.2(Tendermint Core),这与上一节使用的基线版本不同。原因是这个测试网并未针对 v0.37.0-alpha.3(CometBFT)重新测试,因为当时认为没有必要。
与基线测试不同,这些测试所使用的 CometBFT 版本_不_受 #9539 影响;该问题是在 v0.37 的轮换测试网运行结束后立即修复的。
因此,本轮测试引入的负载更高,因为交易不会被拒绝。
延迟
所有延迟的图可见于此。
这与基线版本相似。
相较于基线版本,平均延迟大约增加了 1 秒,这是因为产生的交易负载更高(请记住,基线版本受 #9539 影响,因此负载发生器生成的大多数交易都会被 CheckTx 拒绝)。
Prometheus 指标
这里展示的指标集合与相同实验下基线版本(v0.37)展示的指标大致一致。我们也同时给出了基线结果用于对比。
每分钟区块数和交易数
下图展示了每分钟产生的区块数。
这与下方展示的基线版本相似。
下图仅展示临时节点上报的高度,包括它们在进行 blocksync 和运行 consensus 时的数据。
第二张图是用于对比的基线图。基线图中缺少节点进行 blocksync 时的高度,因为该指标是在之后才实现的。
可以看到,两张图中的高度都呈现出相似模式:随着实验推进,其长度不断增长。
下图展示了每分钟处理的交易数。
作为对比,下图是基线版本的结果。
可以看到,基线图中的速率要低得多。
原因在于基线版本受 #9539 影响,导致 CheckTx 拒绝了负载发生器生成的大多数交易。
Peer 数量
下图展示了整个实验过程中 peer 数量的变化。
这是用于对比的基线图。
两张图中的数值及其变化趋势具有可比性。
有关这些图的更多细节,请参见本节。
常驻内存集大小
在v0.38.0-alpha.2 上,所有进程的平均常驻内存集大小(RSS)明显高于基线版本。
其原因同样是,基线版本中的 CheckTx 拒绝了大多数已提交交易,因此基线上的整体交易负载更低。
这一点与上一节中交易速率图所显示的差异是一致的。
CPU 利用率
下图展示了v0.38.0-alpha.2 和基线版本中所有节点的 load1 指标。
在这两种情况下,大多数时间都保持在 5 以下,这被视为正常负载。
v0.38.0-alpha.2 的平均负载看起来更高一些,因为与基线相比,它每分钟处理的交易数量更多。
测试结果
| 场景 | 日期 | 版本 | 结果 |
|---|---|---|---|
| 轮换 | 2023-05-23 | v0.38.0-alpha.2 (e9abb116e29beb830cf111b824c8e2174d538838) | 通过 |
投票扩展测试平台
在这个测试网中,我们评估向 pre-commit 投票添加不同大小的投票扩展,对 CometBFT 性能造成的影响。 该测试使用我们端到端测试框架中的 Key/Value 存储,其简化流程如下:- 当验证者为高度 的区块发送 pre-commit 投票时,它们首先会在
ExtendVote中按需扩展投票。 - 当高度 的 proposer 创建待提议区块时,它会在
PrepareProposal中在交易列表前插入一笔特殊交易,用于修改一个保留键。该交易的值来源于高度 的扩展;在这个示例中,该值来源于投票扩展,并包含扩展集合本身,且以十六进制字符串形式编码。 - 当验证者为高度 上提议的区块发送 pre-vote 时,它们会先在
ProcessProposal中再次检查区块中的这笔特殊交易是否由 proposer 正确构建。 - 当验证者为高度 上提议的区块发送 pre-commit 时,它们会先扩展投票,然后在高度 $i+2` 及之后重复这些步骤。
vote_extension_size 生成的随机字节序列。
因此,网络上会观察到两个效果。
首先,pre-commit 投票消息大小会增加指定的 vote_extension_size;其次,由于扩展采用十六进制编码,区块消息大小会增加两倍的 vote_extension_size,再乘以接收到的扩展数量,也就是至少 175 的 2/3。
所有测试都在提交 d5baba237ab3a04c1fd4a7b10927ba2e6a2aab27 上执行,该提交对应于 v0.38.0-alpha.2,并额外包含一些提交,用于为测试应用增加可变投票扩展大小的能力。
尽管基线也使用相同提交,但在该配置下,观察到的行为与“原生” v0.38.0-alpha.2 测试应用相同,也就是说,投票扩展是 8 字节整数,并以变长整数压缩编码,而不是大小为 vote_extension_size 的随机序列。
下表汇总了测试用例。
| 名称 | 扩展大小(字节) | 日期 |
|---|---|---|
| 基线 | 8 (varint) | 2023-05-26 |
| 2k | 2048 | 2023-05-29 |
| 4k | 4094 | 2023-05-29 |
| 8k | 8192 | 2023-05-26 |
| 16k | 16384 | 2023-05-26 |
| 32k | 32768 | 2023-05-26 |
延迟
下图展示了每个实验 5 次运行中观察到的延迟;红线表示每次运行的平均值。 从这些图中可以很容易看出,投票扩展越大,延迟波动越明显,高延迟出现得也越频繁。 即便是在 2k 扩展大小的情况下,平均延迟也会从低于 5 秒上升到接近 10 秒。 基线
2k
4k
8k
16k
32k
下列图表将同一实验的所有运行合并展示。
它们表明,随着投票扩展变大,延迟波动显著增加。
特别是在 16k 和 32k 情况下,系统会出现较长时间没有交易交付的间隔。
如后文所述,这是因为某些高度需要经过多轮才能完成,而新交易会被暂存,直到下一个区块达成共识。
| 基线 | 2k |
| 4k | 8k |
| 16k | 32k |
每分钟区块数和交易数
下列图表展示了每分钟产生的区块数和每分钟处理的交易数。 我们将展示分为总览部分和详细样本部分:总览部分展示整个实验(五次运行)的指标,详细样本部分展示五次运行中第一次的指标。 对于其他指标,我们也采用相同方式。 红色虚线表示 20 秒窗口上的移动平均值。总览
从总览图中可以清楚看出,随着投票扩展大小增加,区块创建速率会下降。 尽管交易处理速率也在下降,但看起来下降速度没有区块创建速率那么快。| 实验 | 区块创建速率 | 交易速率 |
|---|---|---|
| 基线 | | |
| 2k | | |
| 4k | | |
| 8k | | |
| 16k | | |
| 32k | | |
第一次运行
| 实验 | 区块创建速率 | 交易速率 |
|---|---|---|
| 基线 | | |
| 2k | | |
| 4k | | |
| 8k | | |
| 16k | | |
| 32k | | |
轮次数量
投票扩展的影响也体现在达成共识所需的轮次数量上。 下列图表展示了整个实验中,为达成共识所需的最高轮次编号。 在基线和较短投票扩展长度下,大多数区块都在第 0 轮达成共识。 随着负载增加,需要的轮次越来越多。 在 32k 情况下,我们可以看到系统频繁进入第 5 轮。| 实验 | 每个区块的轮次数 |
|---|---|
| 基线 | |
| 2k | |
| 4k | |
| 8k | |
| 16k | |
| 32k | |
CPU
在所有测试中,CPU 使用率都达到了相近的峰值,但下列图表显示,投票扩展越大,节点将 CPU 使用率降回去所需的时间越长。 这可能意味着,在扩展较大的测试执行期间,系统正在形成处理积压。| 实验 | CPU |
|---|---|
| 基线 | |
| 2k | |
| 4k | |
| 8k | |
| 16k | |
| 32k | |
常驻内存
对于内存,也可以得出与 CPU 使用率相同的结论。 也就是说,测试期间会形成工作积压,而追赶过程(释放内存)发生在测试结束之后。 一个更令人担忧的趋势是,内存使用的底部值在不同运行之间似乎有所上升。 我们已在更长时间的运行中对此进行了调查,并确认不存在这种趋势。| 实验 | 常驻内存集大小 |
|---|---|
| 基线 | |
| 2k | |
| 4k | |
| 8k | |
| 16k | |
| 32k | |
Mempool 大小
该指标展示节点 mempool 中仍处于待处理状态的交易数量。 请注意,在所有运行中,mempool 中交易的平均数量都会在不同运行之间迅速降至接近零。| 实验 | Mempool 大小 |
|---|---|
| 基线 | |
| 2k | |
| 4k | |
| 8k | |
| 16k | |
| 32k | |
结果
| 场景 | 日期 | 版本 | 结果 |
|---|---|---|---|
| VESize | 2023-05-23 | v0.38.0-alpha.2 + varying vote extensions (9fc711b6514f99b2dc0864fc703cb81214f01783) | 不适用 |
CometBFT QA Results v0.38.x
This iteration of the QA was run on CometBFTv0.38.0-alpha.2, the second
v0.38.x version from the CometBFT repository.
The changes with respect to the baseline, v0.37.0-alpha.3 from Feb 21, 2023,
include the introduction of the FinalizeBlock method to complete the full
range of ABCI++ functionality (ABCI 2.0), and several other improvements
described in the
CHANGELOG.
Issues Discovered
- (critical, fixed) #539 and #546 - This bug causes the proposer to crash in
PrepareProposalbecause it does not have extensions when it should. This happens mainly when the proposer was catching up. - (critical, fixed) #562 - There were several bugs in the metrics-related logic that were causing panics when the testnets were started.
200 Node Testnet
As in other iterations of our QA process, we have used a 200-node network as a testbed, plus nodes to introduce load and collect metrics.Saturation Point
As in previous iterations of our QA experiments, we first find the transaction load at which the system begins to show degraded performance. Then we run the experiments with the system subjected to a load slightly under the saturation point. The method to identify the saturation point is explained here and its application to the baseline is described here. The following table summarizes the results for the different experiments (extracted fromv038_report_tabbed.txt). The X axis
(c) is the number of connections created by the load runner process to the
target node. The Y axis (r) is the rate or number of transactions issued per
second.
| c=1 | c=2 | c=4 | |
|---|---|---|---|
| r=200 | 17800 | 33259 | 33259 |
| r=400 | 35600 | 41565 | 41384 |
| r=800 | 36831 | 38686 | 40816 |
| r=1600 | 40600 | 45034 | 39830 |
c=1,r=400 and c=2,r=200. Entries in the diagonal have
the same amount of transaction load, so we can consider them equivalent. For the
chosen diagonal, the expected number of processed transactions is 1 * 400 tx/s * 89 s = 35600.
(Note that we use 89 out of 90 seconds of the experiment because the last transaction batch
coincides with the end of the experiment and is thus not sent.) The experiments in the diagonal
below expect double that number, that is, 1 * 800 tx/s * 89 s = 71200, but the
system is not able to process such a load, thus it is saturated.
Therefore, for the rest of these experiments, we chose c=1,r=400 as the
configuration. We could have chosen the equivalent c=2,r=200, which is the same
as used in our baseline version, but for simplicity we decided to use the one with
only one connection.
Also note that, compared to the previous QA tests, we have tried to find the
saturation point within a higher range of load values for the rate r. In
particular, we ran tests with r equal to or above 200, while in the previous
tests r was 200 or lower. In particular, for our baseline version we didn’t
run the experiment on the configuration c=1,r=400.
For comparison, this is the table for the baseline version, where the
saturation point is beyond the diagonal defined by r=200,c=2 and r=100,c=4.
| c=1 | c=2 | c=4 | |
|---|---|---|---|
| r=25 | 2225 | 4450 | 8900 |
| r=50 | 4450 | 8900 | 17800 |
| r=100 | 8900 | 17800 | 35600 |
| r=200 | 17800 | 35600 | 38660 |
Latencies
The following figure plots the latencies of the experiment carried out with the configurationc=1,r=400.
For reference, the following figure shows the latencies of one of the
experiments for c=2,r=200 in the baseline.
As can be seen, in most cases the latencies are very similar, and in some cases,
the baseline has slightly higher latencies than the version under test. Thus,
from this small experiment, we can say that the latencies measured for the two
versions are equivalent, or at least that the version under test is not worse
than the baseline.
Prometheus Metrics on the Chosen Experiment
This section further examines key metrics for this experiment extracted from Prometheus data regarding the chosen experiment with configurationc=1,r=400.
Mempool Size
The mempool size, a count of the number of transactions in the mempool, was shown to be stable and homogeneous at all full nodes. It did not exhibit any unconstrained growth. The plot below shows the evolution over time of the cumulative number of transactions inside all full nodes’ mempools at a given time.
The following picture shows the evolution of the average mempool size over all
full nodes, which mostly oscillates between 1000 and 2500 outstanding
transactions.
The peaks observed coincide with the moments when some nodes reached round 1 of
consensus (see below).
The behavior is similar to that observed in the baseline, presented next.
Peers
The number of peers was stable at all nodes. It was higher for the seed nodes (around 140) than for the rest (between 20 and 70 for most nodes). The red dashed line denotes the average value.
Just as in the baseline, shown next, the fact that non-seed nodes reach more
than 50 peers is due to #9548.
Consensus Rounds per Height
Most heights took just one round, that is, round 0, but some nodes needed to advance to round 1.
The following specific run of the baseline required some nodes to reach round 1.
Blocks Produced per Minute, Transactions Processed per Minute
The following plot shows the rate at which blocks were created, from the point of view of each node. That is, it shows when each node learned that a new block had been agreed upon.
For most of the time when load was being applied to the system, most of the
nodes stayed around 20 blocks/minute.
The spike to more than 100 blocks/minute is due to a slow node catching up.
The baseline experienced similar behavior.
The collective spike on the right of the graph marks the end of the load
injection, when blocks become smaller (empty) and impose less strain on the
network. This behavior is reflected in the following graph, which shows the
number of transactions processed per minute.
The following is the transaction processing rate of the baseline, which is
similar to the above.
Memory Resident Set Size
The following graph shows the Resident Set Size of all monitored processes, with maximum memory usage of 1.6GB, slightly lower than the baseline shown after.
Similar behavior was shown in the baseline, with even slightly higher memory
usage.
The memory of all processes went down as the load was removed, showing no signs
of unconstrained growth.
CPU Utilization
Comparison to Baseline
The best metric from Prometheus to gauge CPU utilization on a Unix machine isload1, as it usually appears in the output of
top.
The load is contained below 5 on most nodes, as seen in the following graph.
The baseline had similar behavior.
Impact of Vote Extension Signature Verification
It is important to note that the baseline (v0.37.x) does not implement vote extensions,
whereas the version under test (v0.38.0-alpha.2) does implement them, and they are
configured to be activated since height 1.
The e2e application used in these tests verifies all received vote extension signatures (up to 175)
twice per height: upon PrepareProposal (for sanity) and upon ProcessProposal (to demonstrate how
real applications can do it).
The fact that there is no noticeable difference in the CPU utilization plots of
the baseline and v0.38.0-alpha.2 means that re-verifying up to 175 vote extension signatures twice
(besides the initial verification done by CometBFT when receiving them from the network)
has no performance impact in the current version of the system: the bottlenecks are elsewhere.
Thus, we should focus on optimizing other parts of the system: the ones that cause the current
bottlenecks (mempool gossip duplication, leaner proposal structure, optimized consensus gossip).
Test Results
The comparison against the baseline results shows that both scenarios had similar numbers and are therefore equivalent. A summary of these tests is shown in the following table, along with the commit versions used in the experiments.| Scenario | Date | Version | Result |
|---|---|---|---|
| 200-node | 2023-05-21 | v0.38.0-alpha.2 (1f524d12996204f8fd9d41aa5aca215f80f06f5e) | Pass |
Rotating Node Testnet
We usec=1,r=400 as load, which can be considered a safe workload, as it was close to (but below)
the saturation point in the 200 node testnet. This testnet has fewer nodes (10 validators and 25 full nodes).
Importantly, the baseline considered in this section is v0.37.0-alpha.2 (Tendermint Core),
which is different from the one used in the previous section.
The reason is that this testnet was not re-tested for v0.37.0-alpha.3 (CometBFT),
since it was not deemed necessary.
Unlike in the baseline tests, the version of CometBFT used for these tests is not affected by #9539,
which was fixed right after having run the rotating testnet for v0.37.
As a result, the load introduced in this iteration of the test is higher as transactions do not get rejected.
Latencies
The plot of all latencies can be seen here.
This is similar to the baseline.
The average increase of about 1 second with respect to the baseline is due to the higher
transaction load produced (remember the baseline was affected by #9539, whereby most transactions
produced were rejected by CheckTx).
Prometheus Metrics
The set of metrics shown here roughly matches those shown for the baseline (v0.37) for the same experiment.
We also show the baseline results for comparison.
Blocks and Transactions per Minute
The following plot shows the blocks produced per minute.
This is similar to the baseline, shown below.
The following plot shows only the heights reported by ephemeral nodes, both when they were blocksyncing
and when they were running consensus.
The second plot is the baseline plot for comparison. The baseline lacks the heights when the nodes were
blocksyncing as that metric was implemented afterwards.
We see that heights follow a similar pattern in both plots: they grow in length as the experiment advances.
The following plot shows the transactions processed per minute.
For comparison, this is the baseline plot.
We can see the rate is much lower in the baseline plot.
The reason is that the baseline was affected by #9539, whereby CheckTx rejected most transactions
produced by the load runner.
Peers
The plot below shows the evolution of the number of peers throughout the experiment.
This is the baseline plot, for comparison.
The plotted values and their evolution are comparable in both plots.
For further details on these plots, see this section.
Memory Resident Set Size
The average Resident Set Size (RSS) over all processes is notably larger onv0.38.0-alpha.2 than on the baseline.
The reason for this is, again, the fact that CheckTx was rejecting most transactions submitted on the baseline
and therefore the overall transaction load was lower on the baseline.
This is consistent with the difference seen in the transaction rate plots
in the previous section.
CPU Utilization
The plots show metricload1 for all nodes for v0.38.0-alpha.2 and for the baseline.
In both cases, it is contained under 5 most of the time, which is considered normal load.
The load seems to be more significant on v0.38.0-alpha.2 on average because of the larger
number of transactions processed per minute as compared to the baseline.
Test Result
| Scenario | Date | Version | Result |
|---|---|---|---|
| Rotating | 2023-05-23 | v0.38.0-alpha.2 (e9abb116e29beb830cf111b824c8e2174d538838) | Pass |
Vote Extensions Testbed
In this testnet we evaluate the effect of varying the sizes of vote extensions added to pre-commit votes on the performance of CometBFT. The test uses the Key/Value store in our end-to-end test framework, which has the following simplified flow:- When validators send their pre-commit votes for a block at height , they first extend the vote as they see fit in
ExtendVote. - When a proposer for height creates a block to propose, in
PrepareProposal, it prepends the transactions with a special transaction, which modifies a reserved key. The transaction value is derived from the extensions from height ; in this example, the value is derived from the vote extensions and includes the set itself, hex encoded as a string. - When a validator sends their pre-vote for the block proposed in , they first double check in
ProcessProposalthat the special transaction in the block was properly built by the proposer. - When validators send their pre-commit for the block proposed in , they first extend the vote, and the steps repeat for heights and so on.
vote_extension_size.
Hence, two effects are seen on the network.
First, pre-commit vote message sizes will increase by the specified vote_extension_size and, second, block messages will increase by twice vote_extension_size, given the hex encoding of extensions, times the number of extensions received, i.e., at least 2/3 of 175.
All tests were performed on commit d5baba237ab3a04c1fd4a7b10927ba2e6a2aab27, which corresponds to v0.38.0-alpha.2 plus commits to add the ability to vary the vote extension sizes to the test application.
Although the same commit is used for the baseline, in this configuration the behavior observed is the same as in the “vanilla” v0.38.0-alpha.2 test application, that is, vote extensions are 8-byte integers, compressed as variable-size integers instead of a random sequence of size vote_extension_size.
The following table summarizes the test cases.
| Name | Extension Size (bytes) | Date |
|---|---|---|
| baseline | 8 (varint) | 2023-05-26 |
| 2k | 2048 | 2023-05-29 |
| 4k | 4094 | 2023-05-29 |
| 8k | 8192 | 2023-05-26 |
| 16k | 16384 | 2023-05-26 |
| 32k | 32768 | 2023-05-26 |
Latency
The following figures show the latencies observed in each of the 5 runs of each experiment; the red line shows the average of each run. It can be easily seen from these graphs that the larger the vote extension size, the more latency varies and the more common higher latencies become. Even in the case of extensions of size 2k, the mean latency goes from below 5s to nearly 10s. Baseline
2k
4k
8k
16k
32k
The following graphs combine all the runs of the same experiment.
They show that latency variation greatly increases with the increase of vote extensions.
In particular, for the 16k and 32k cases, the system goes through large gaps without transaction delivery.
As discussed later, this is the result of heights taking multiple rounds to finish and new transactions being held until the next block is agreed upon.
| baseline | 2k |
| 4k | 8k |
| 16k | 32k |
Blocks and Transactions per Minute
The following plots show the blocks produced per minute and transactions processed per minute. We have divided the presentation into an overview section, which shows the metrics for the whole experiment (five runs) and a detailed sample, which shows the metrics for the first of the five runs. We repeat the approach for the other metrics as well. The dashed red line shows the moving average over a 20s window.Overview
It is clear from the overview plots that as the vote extension sizes increase, the rate of block creation decreases. Although the rate of transaction processing also decreases, it does not seem to decrease as fast.| Experiment | Block creation rate | Transaction rate |
|---|---|---|
| baseline | | |
| 2k | | |
| 4k | | |
| 8k | | |
| 16k | | |
| 32k | | |
First Run
| Experiment | Block creation rate | Transaction rate |
|---|---|---|
| baseline | | |
| 2k | | |
| 4k | | |
| 8k | | |
| 16k | | |
| 32k | | |
Number of Rounds
The effect of vote extensions is also felt in the number of rounds needed to reach consensus. The following graphs show the number of the highest round required to reach consensus during the whole experiment. In the baseline and low vote extension lengths, most blocks were agreed upon during round 0. As the load increases, more and more rounds were required. In the 32k case we see round 5 being reached frequently.| Experiment | Number of Rounds per Block |
|---|---|
| baseline | |
| 2k | |
| 4k | |
| 8k | |
| 16k | |
| 32k | |
CPU
The CPU usage reached the same peaks in all tests, but the following graphs show that with larger vote extensions, nodes take longer to reduce the CPU usage. This could mean that a backlog of processing is forming during the execution of the tests with larger extensions.| Experiment | CPU |
|---|---|
| baseline | |
| 2k | |
| 4k | |
| 8k | |
| 16k | |
| 32k | |
Resident Memory
The same conclusion reached for CPU usage may be drawn for the memory. That is, a backlog of work is formed during the tests and catching up (freeing of memory) happens after the test is done. A more worrying trend is that the bottom of the memory usage seems to increase between runs. We have investigated this in longer runs and confirmed that there is no such trend.| Experiment | Resident Set Size |
|---|---|
| baseline | |
| 2k | |
| 4k | |
| 8k | |
| 16k | |
| 32k | |
Mempool Size
This metric shows how many transactions are outstanding in the nodes’ mempools. Observe that in all runs, the average number of transactions in the mempool quickly drops to near zero between runs.| Experiment | Mempool Size |
|---|---|
| baseline | |
| 2k | |
| 4k | |
| 8k | |
| 16k | |
| 32k | |
Results
| Scenario | Date | Version | Result |
|---|---|---|---|
| VESize | 2023-05-23 | v0.38.0-alpha.2 + varying vote extensions (9fc711b6514f99b2dc0864fc703cb81214f01783) | N/A |